The Trade Desk, Inc.'s management explains the business in its own materials. The slides below do the most of that work, pulled from the documents preserved in Sources. Each source link opens the complete presentation at that slide in a new tab.
The current, self-contained overview of what The Trade Desk does, how it makes money, and its main growth drivers — the fastest path from zero to a working understanding. · Open the full document →
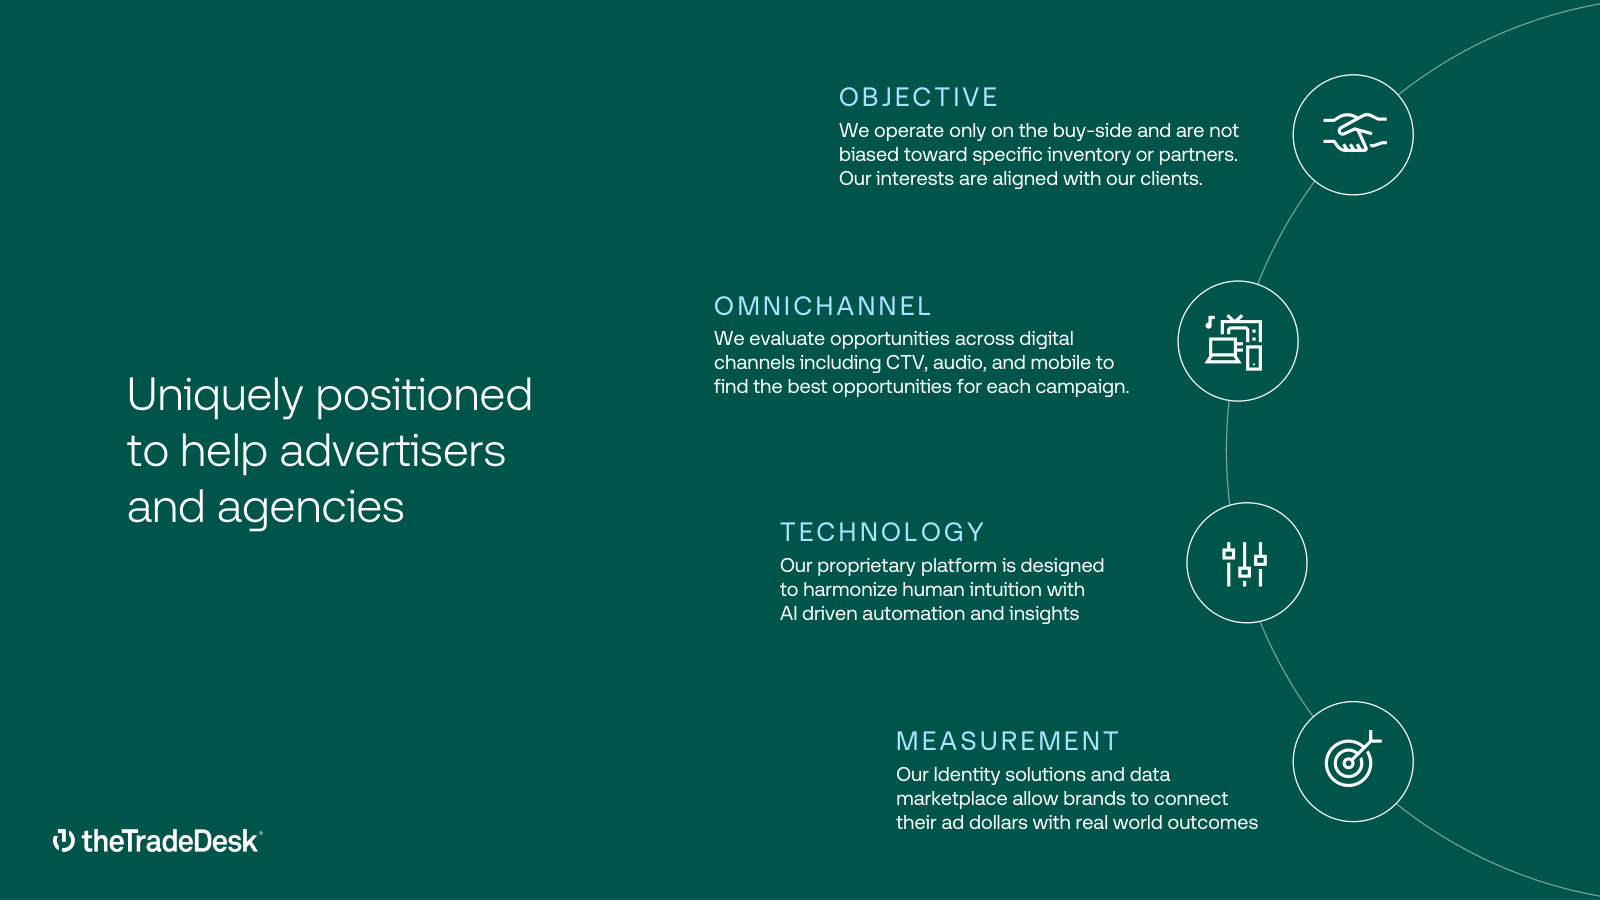
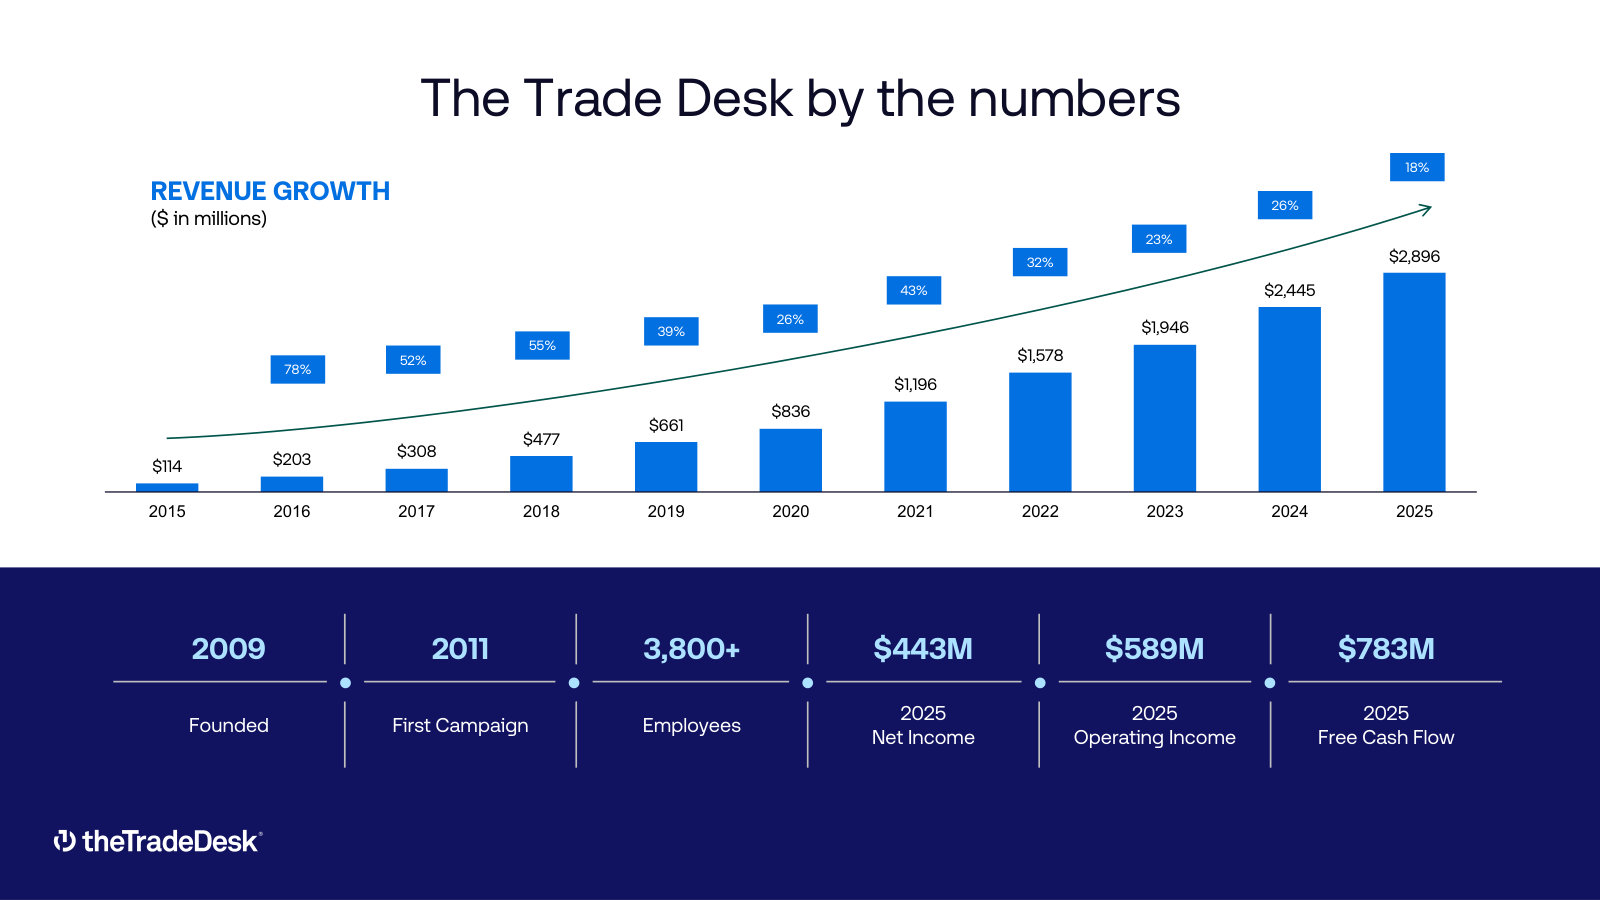
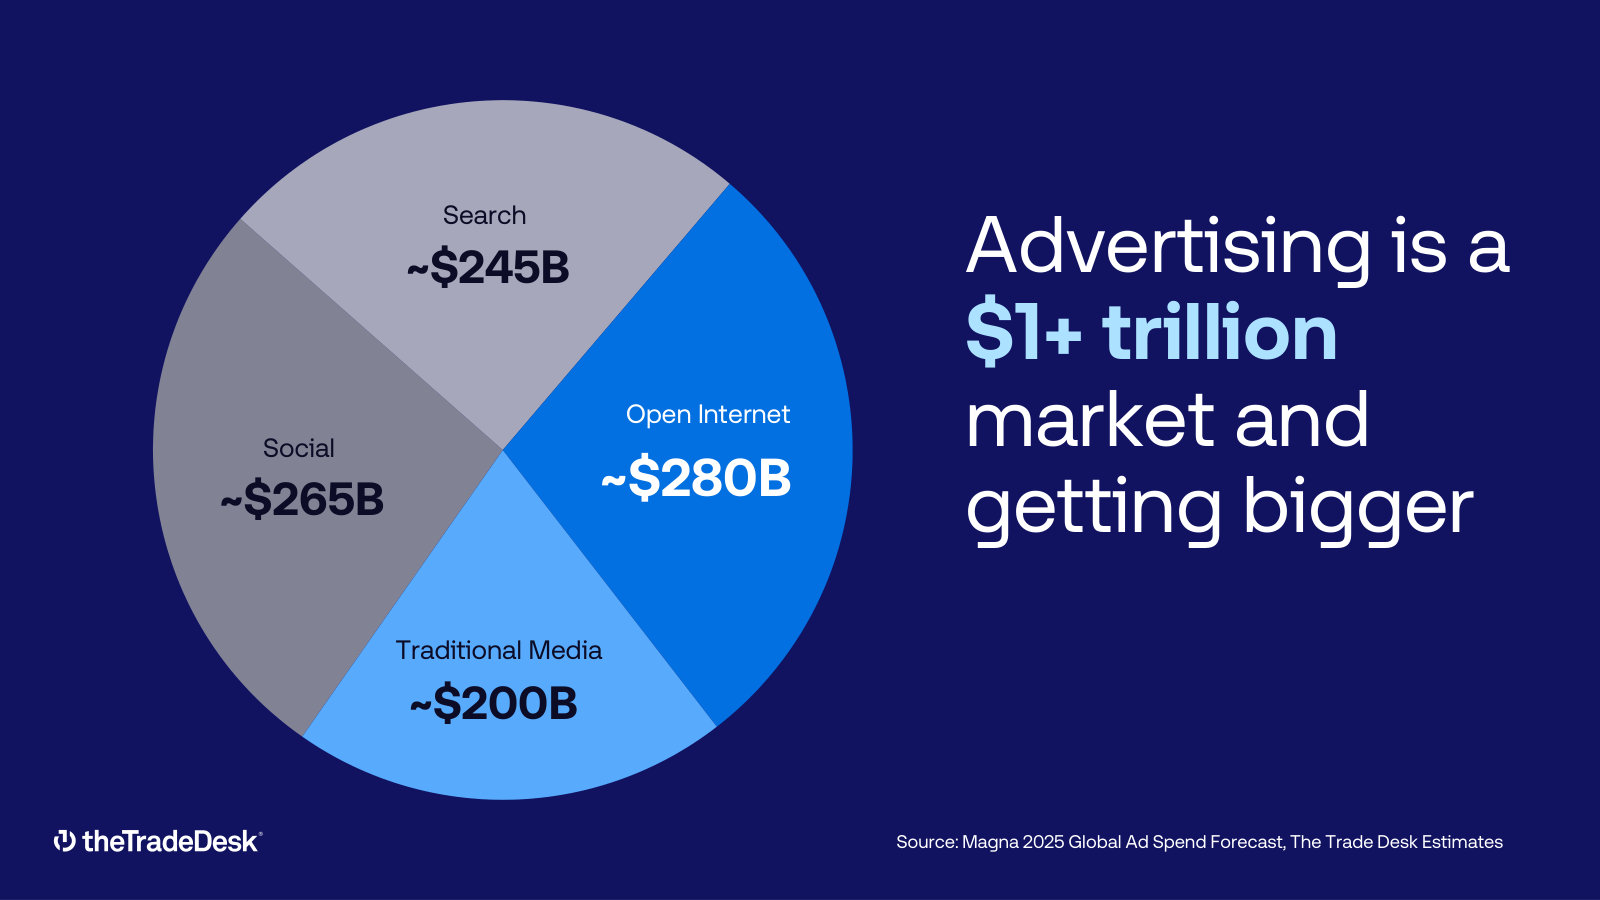
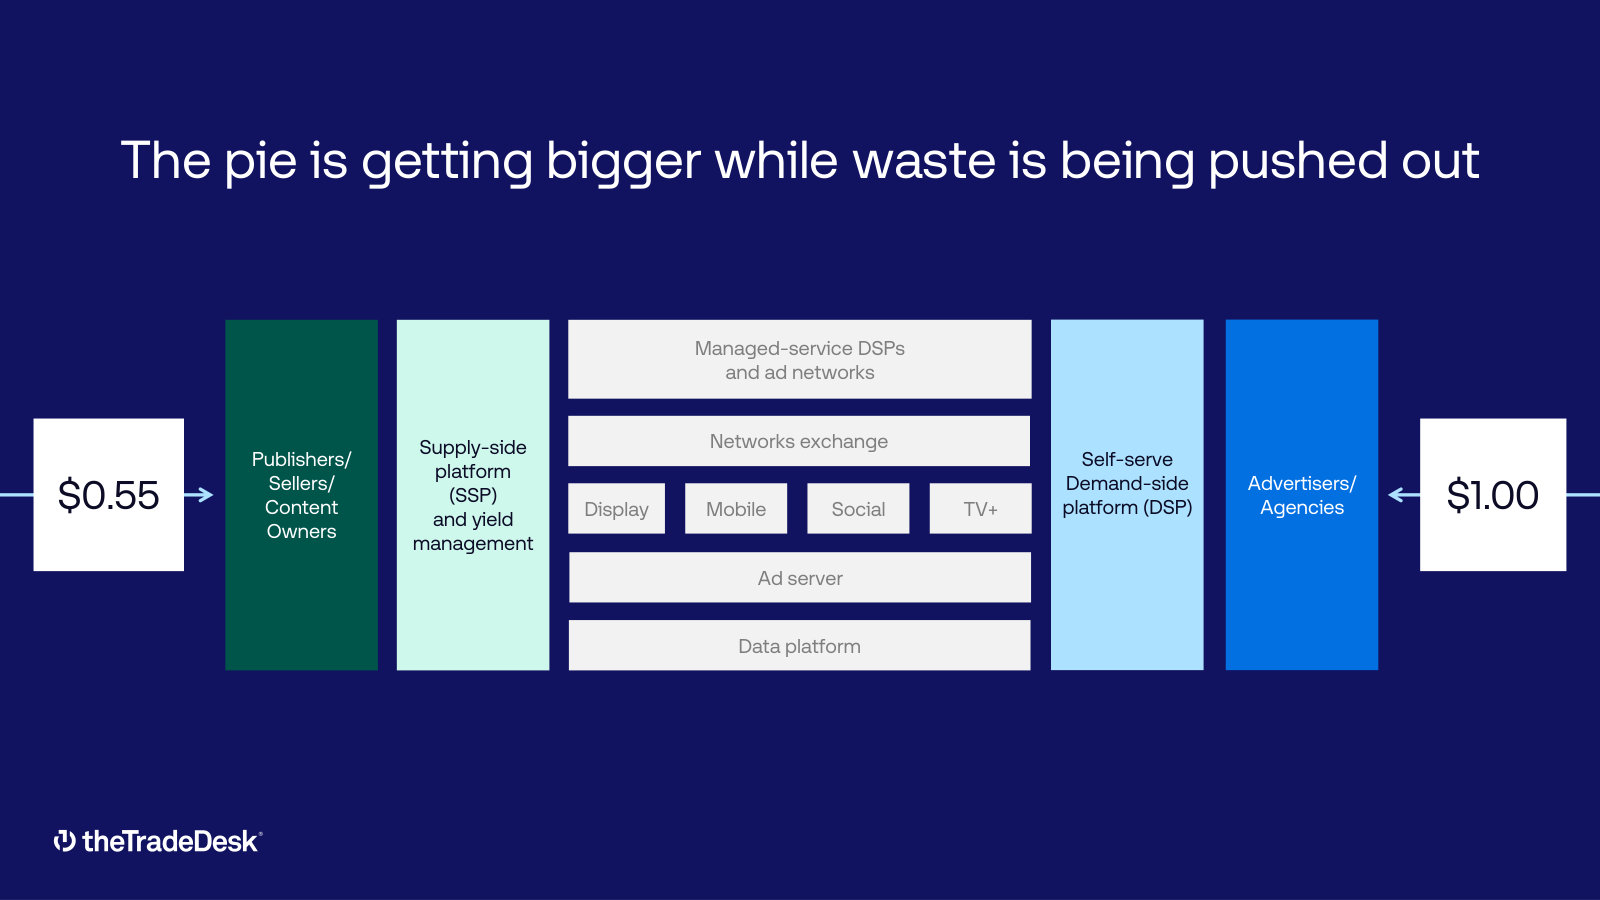
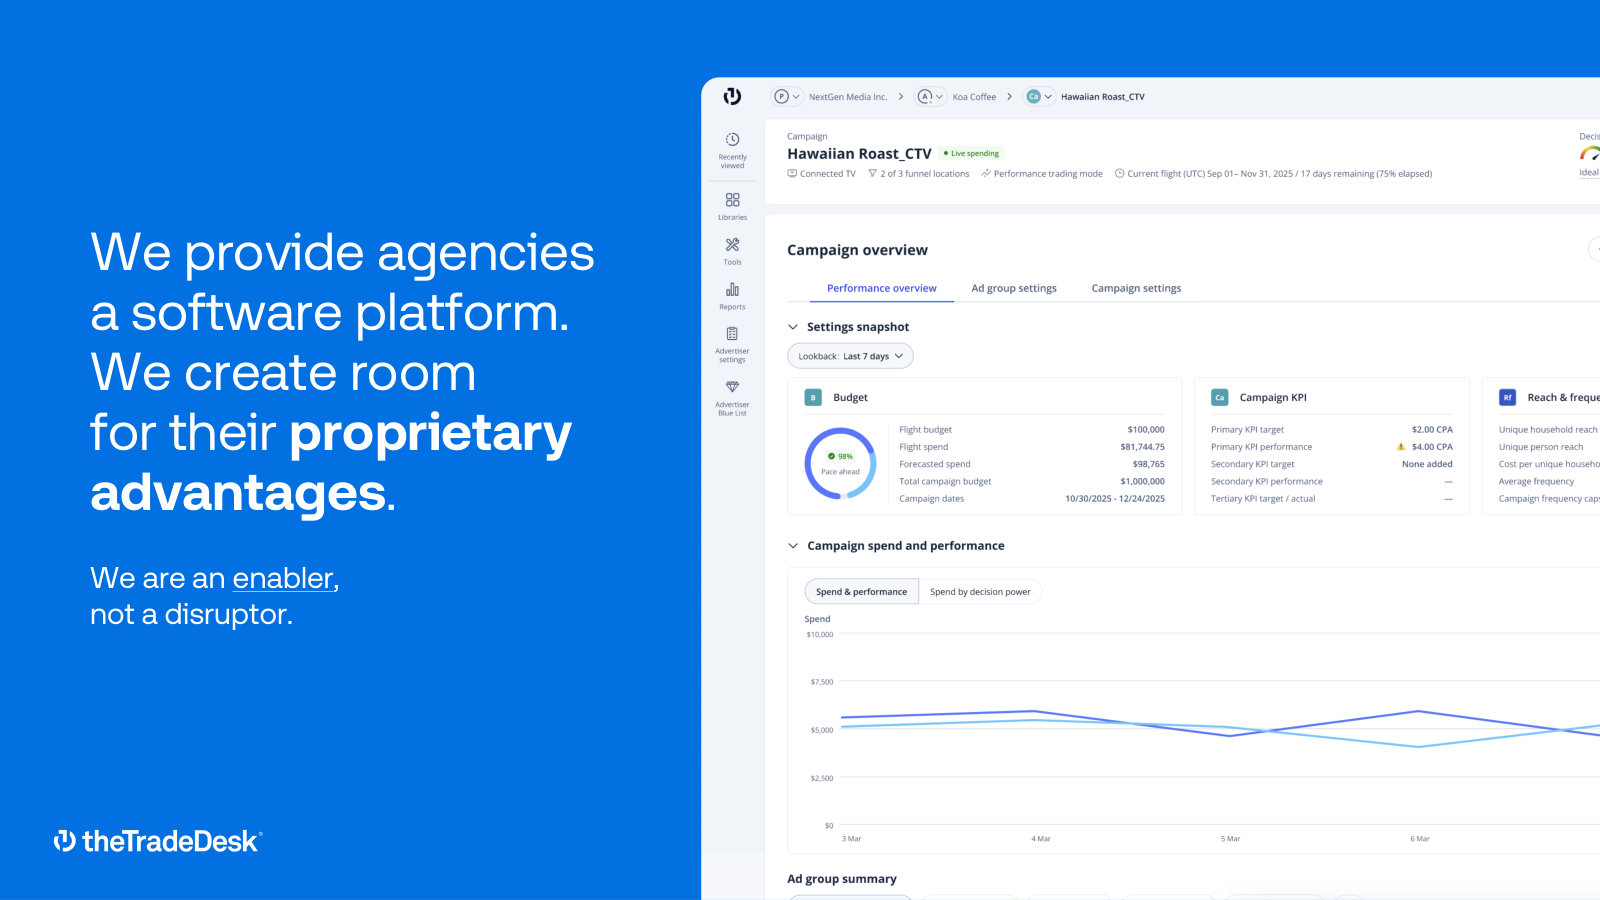
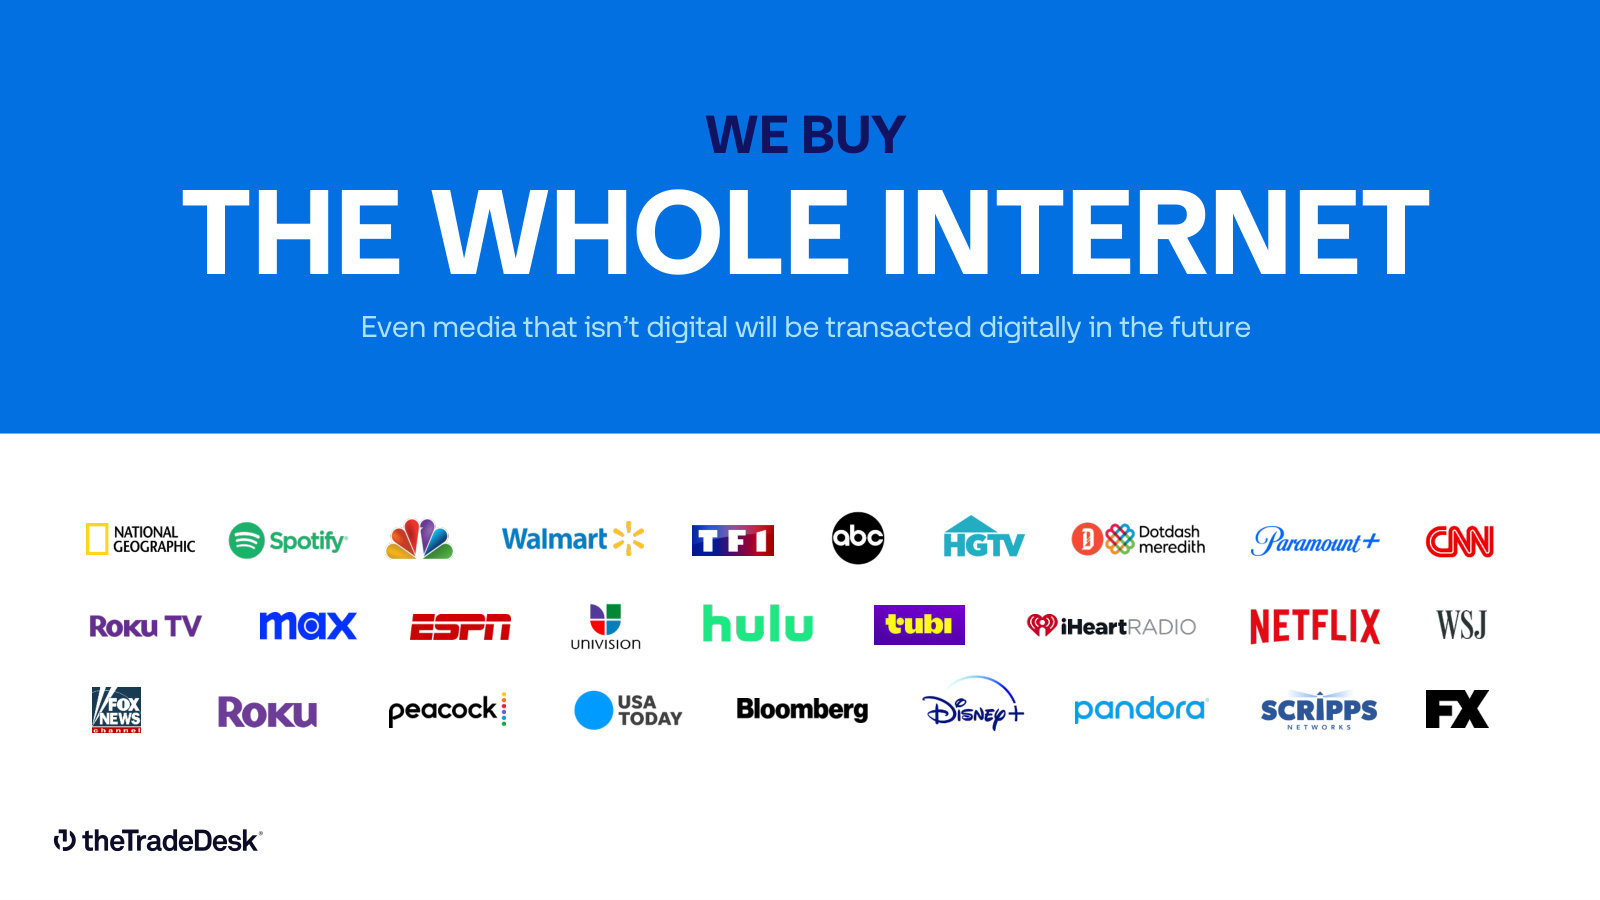
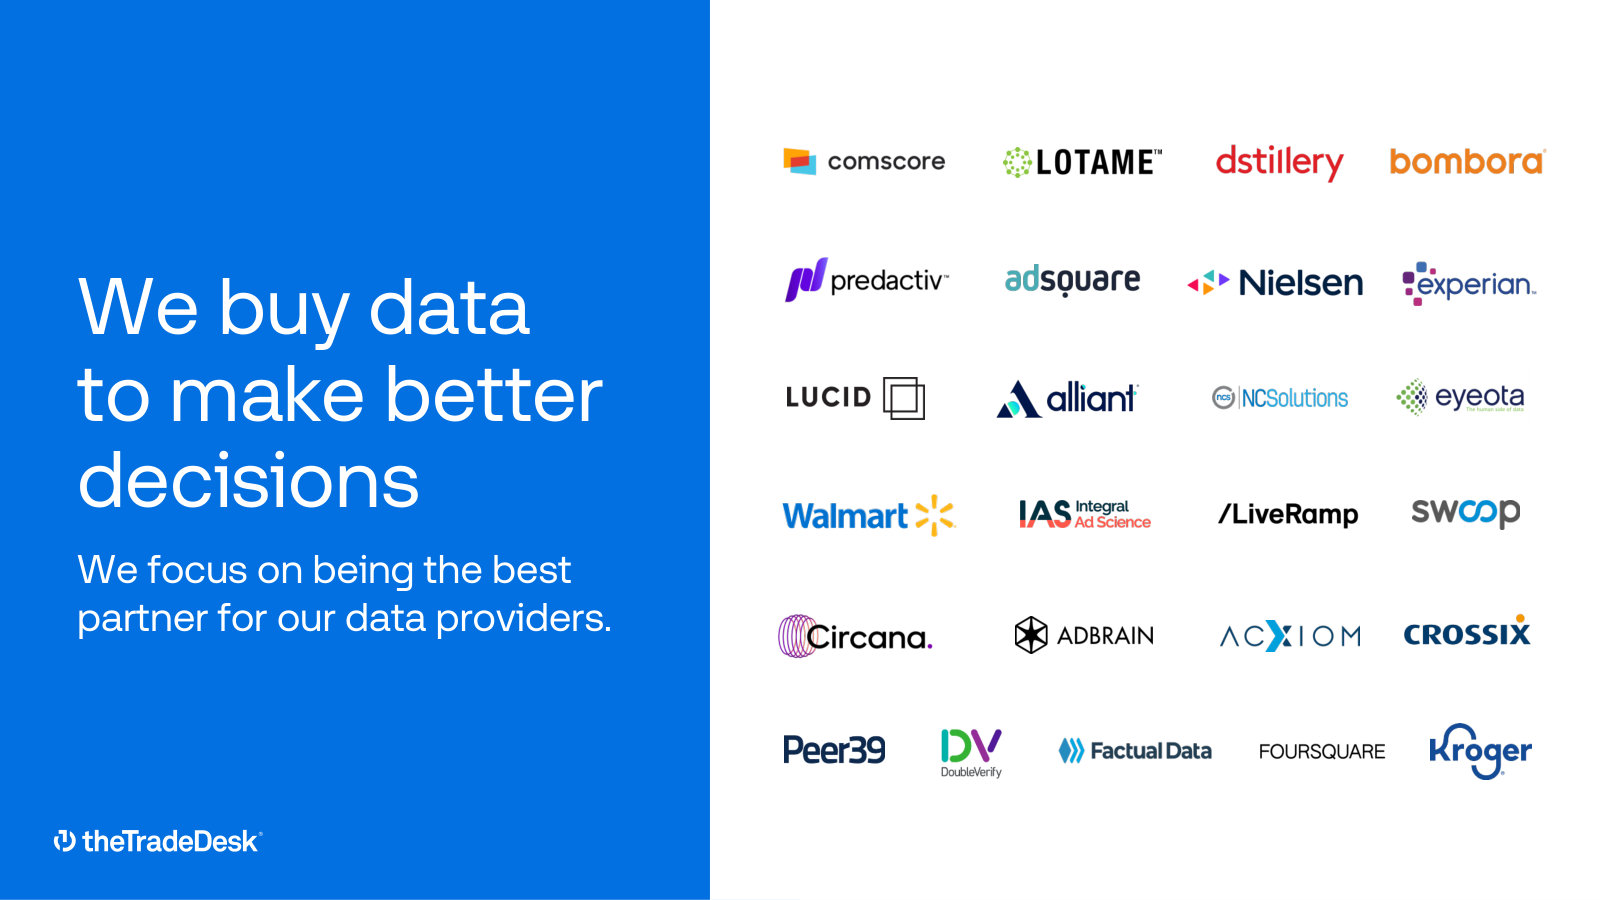
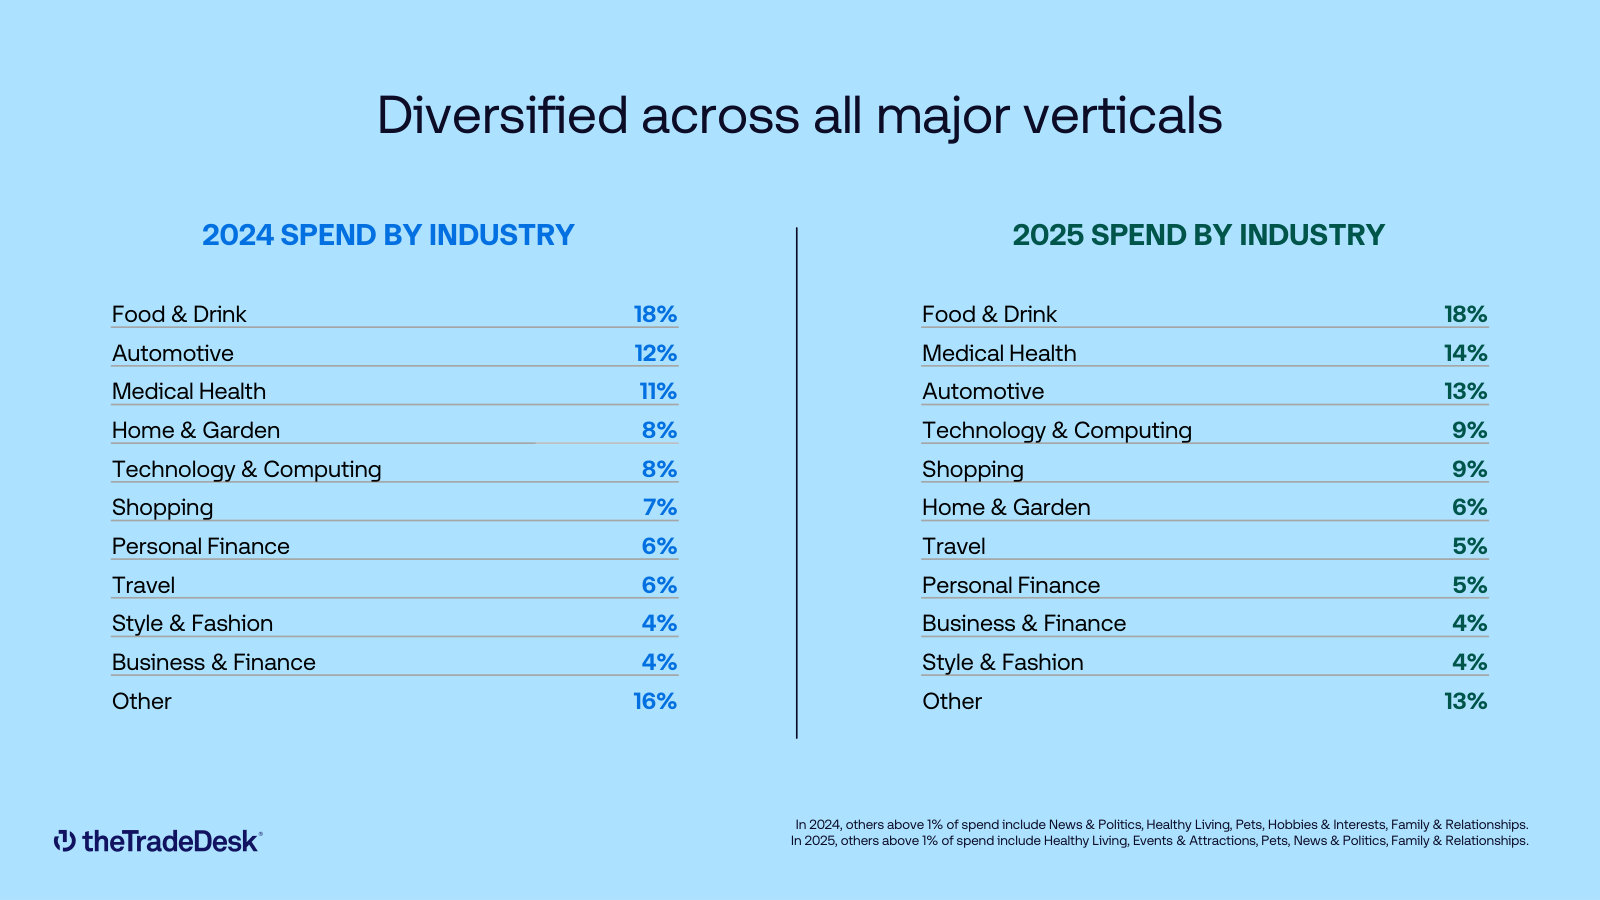
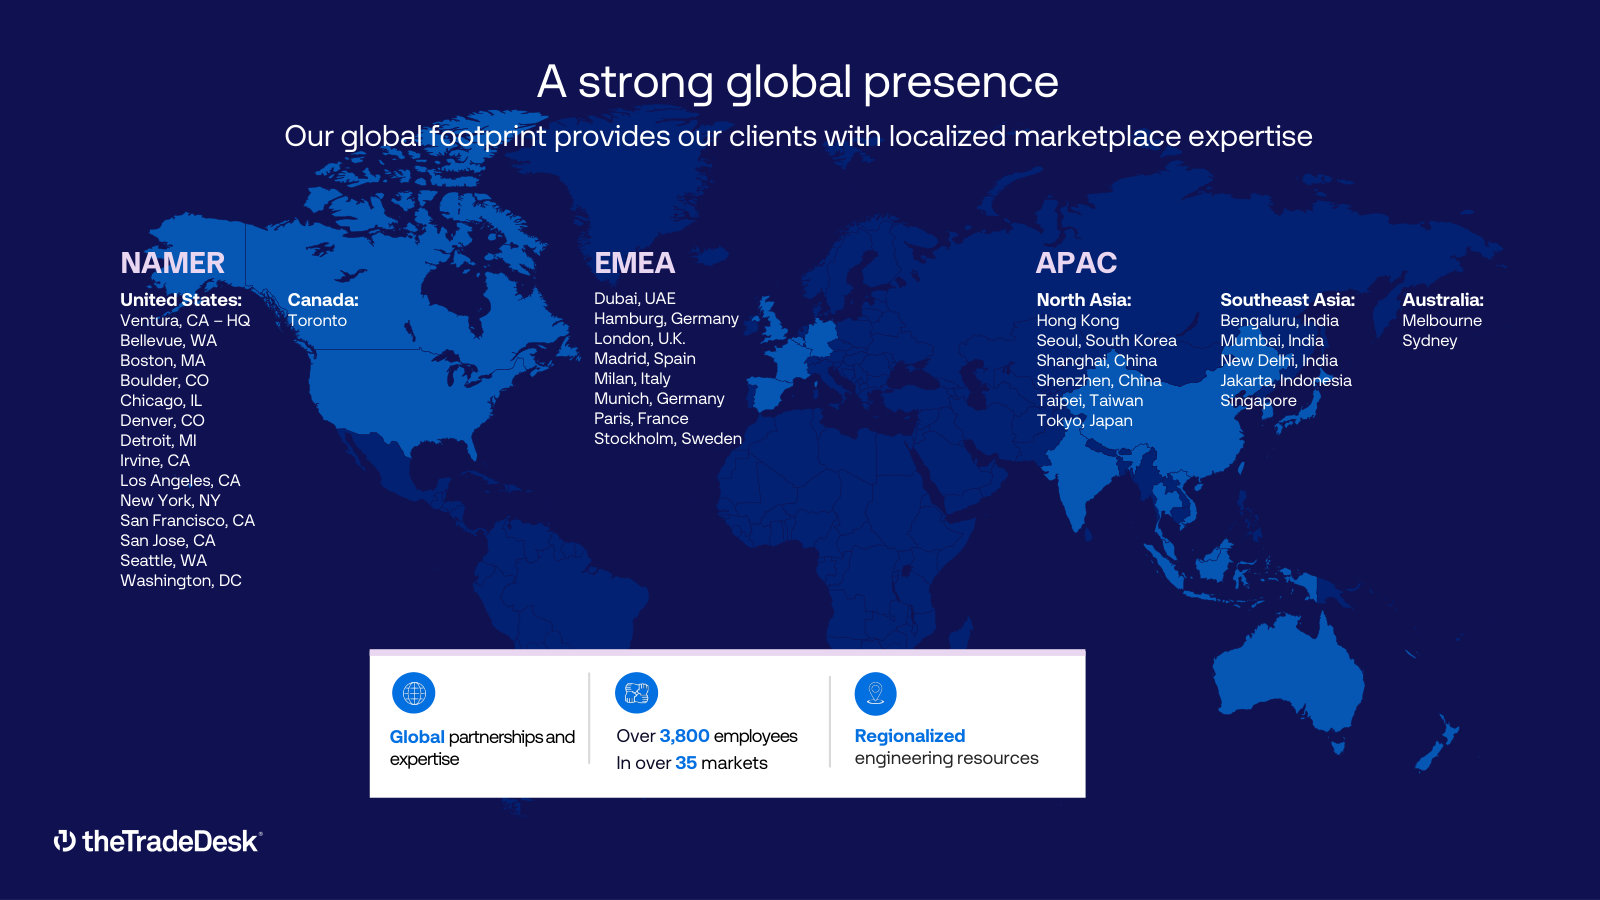
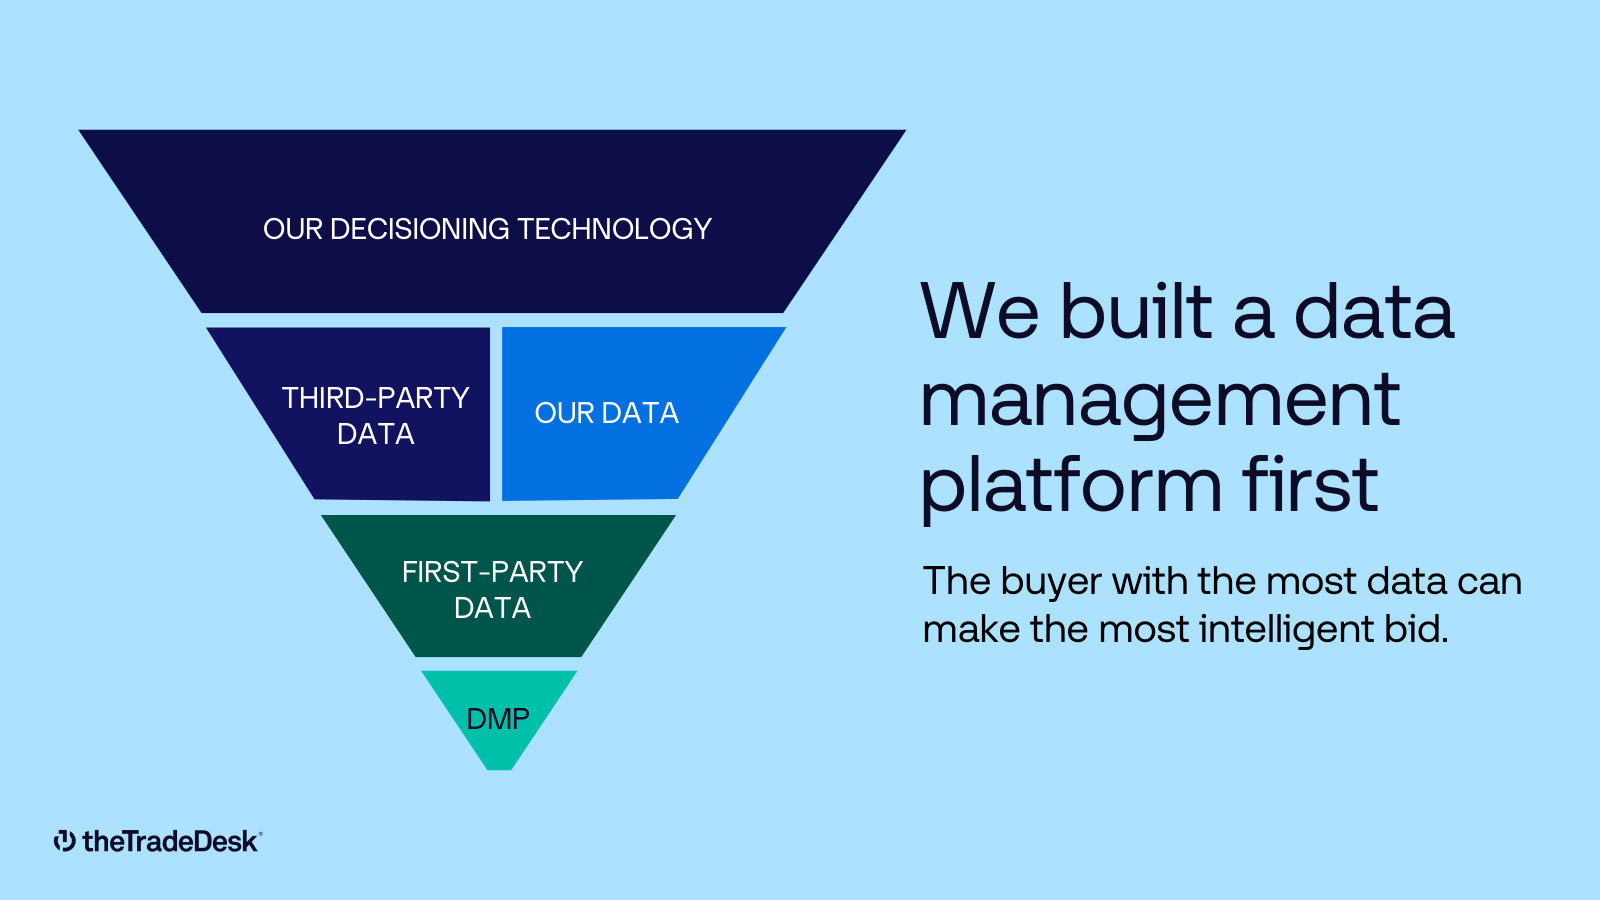
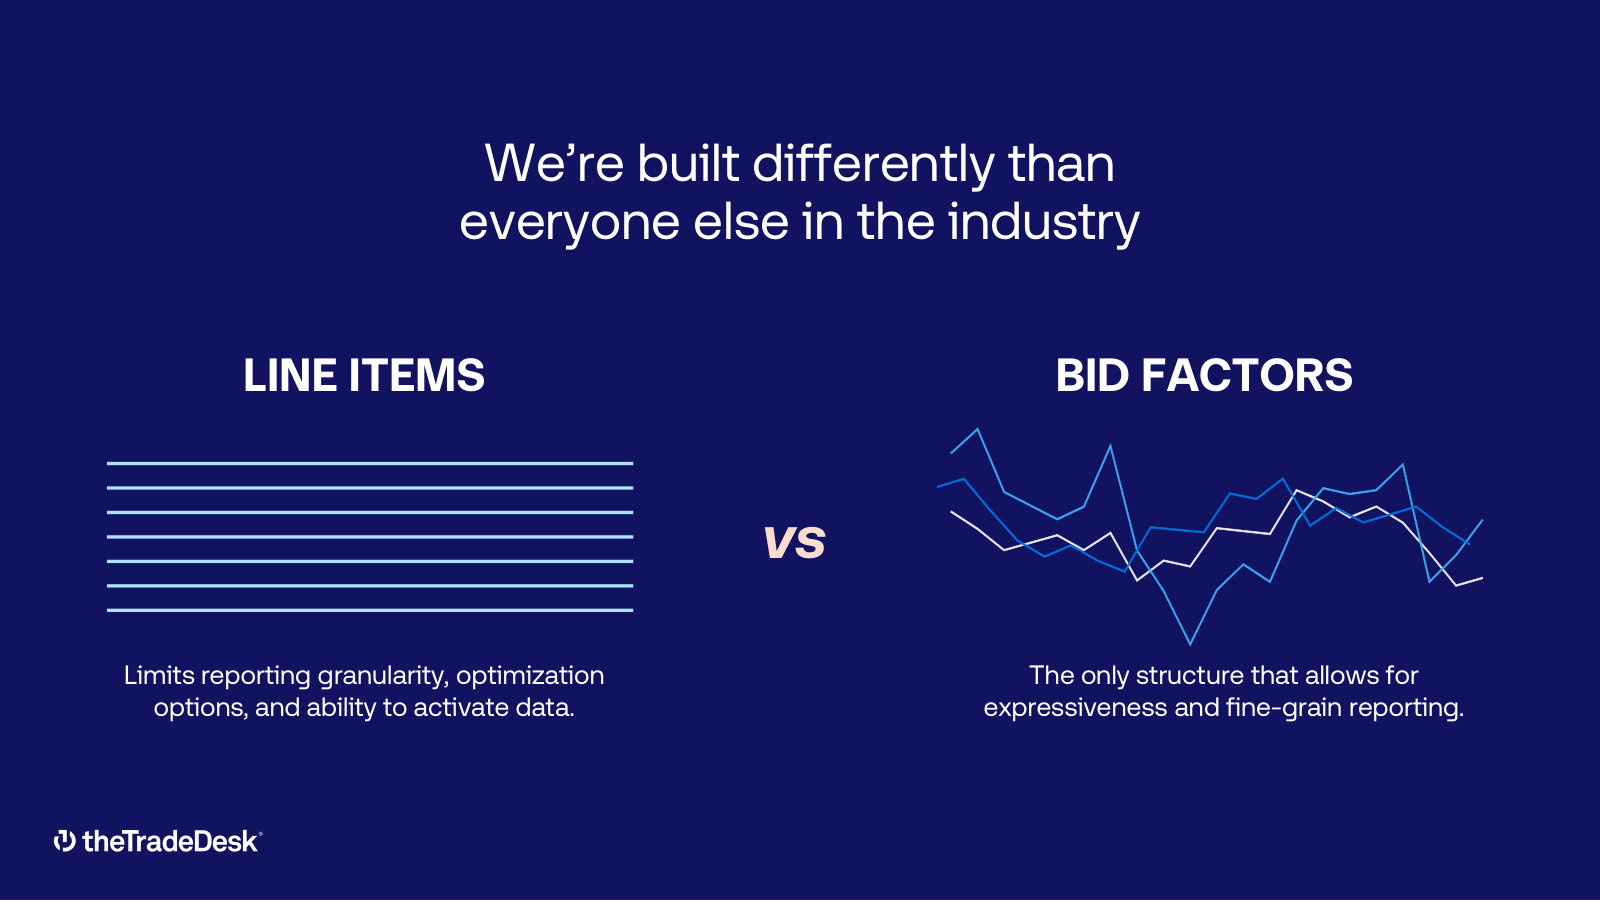
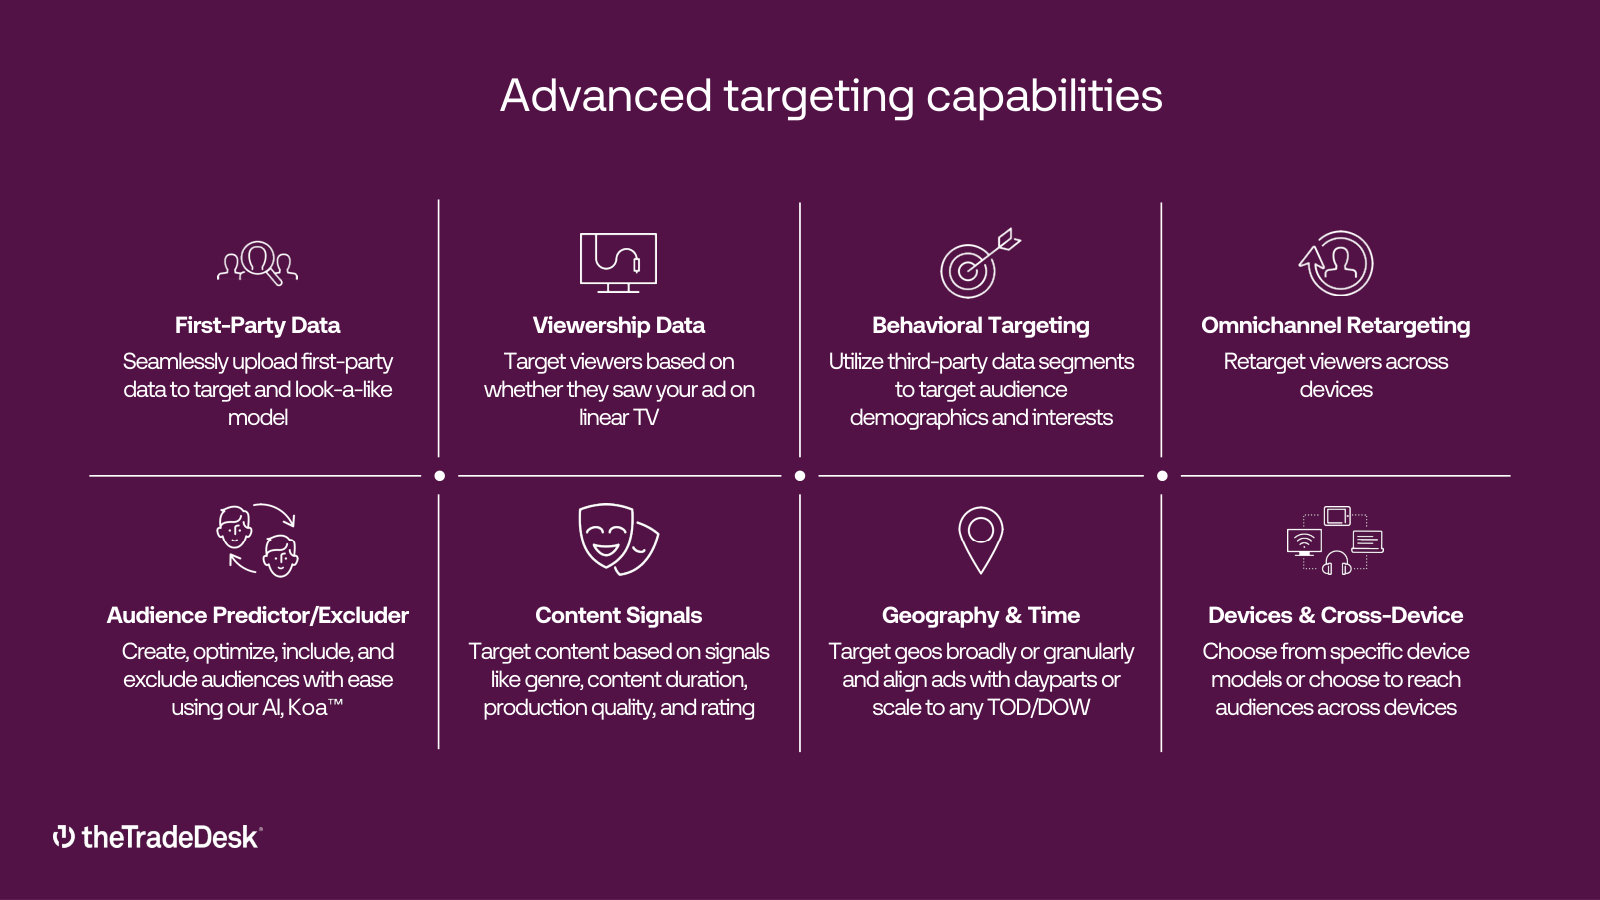
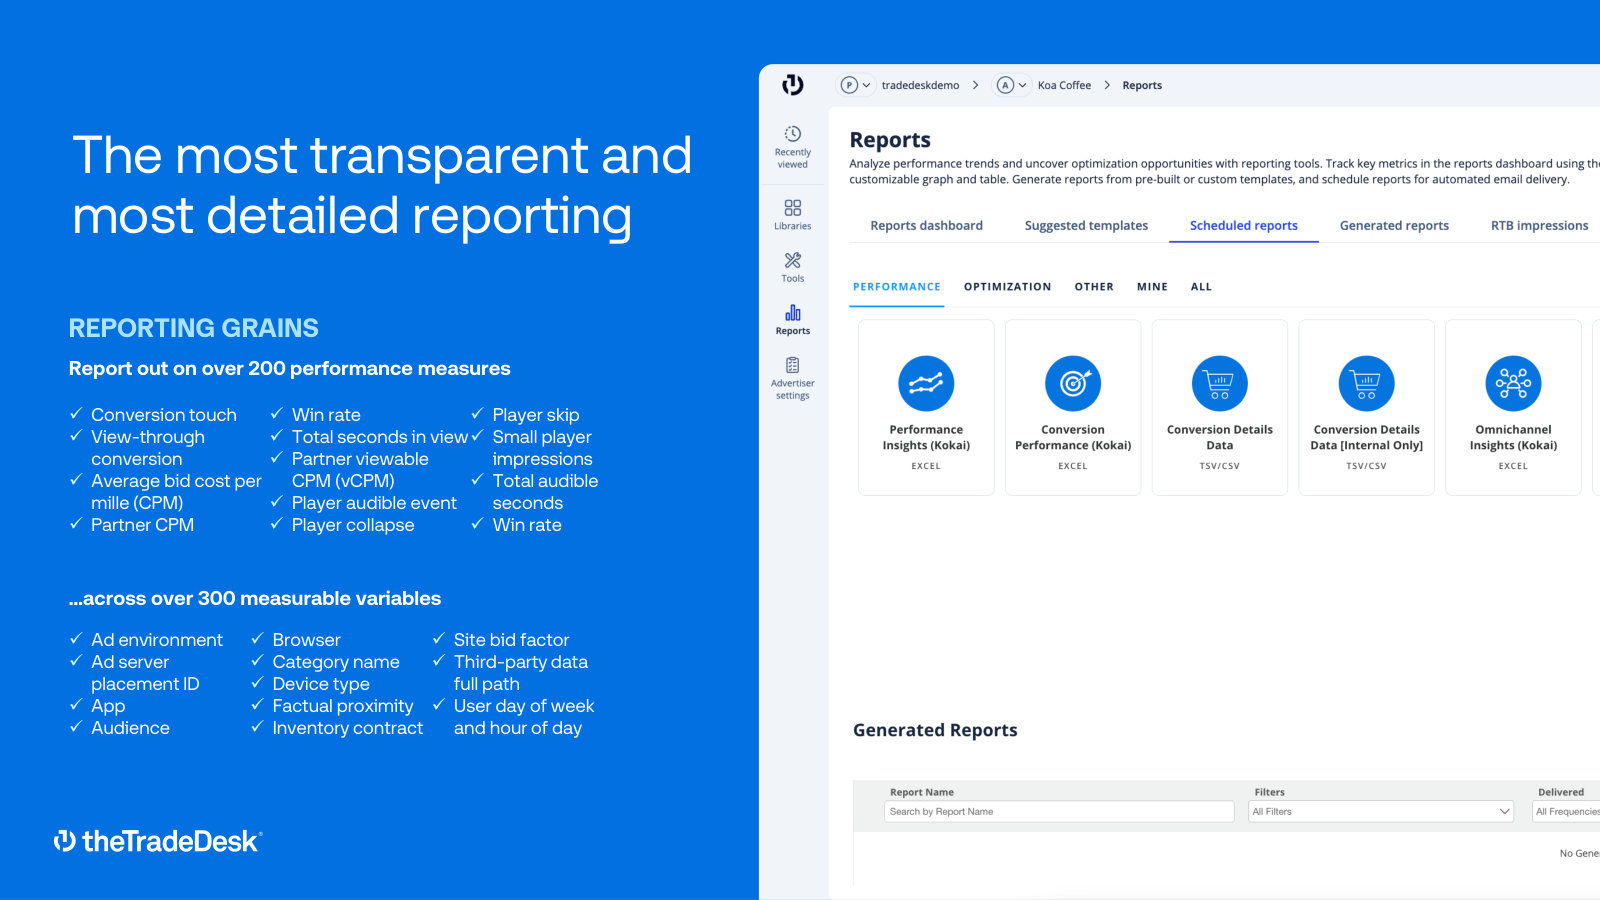
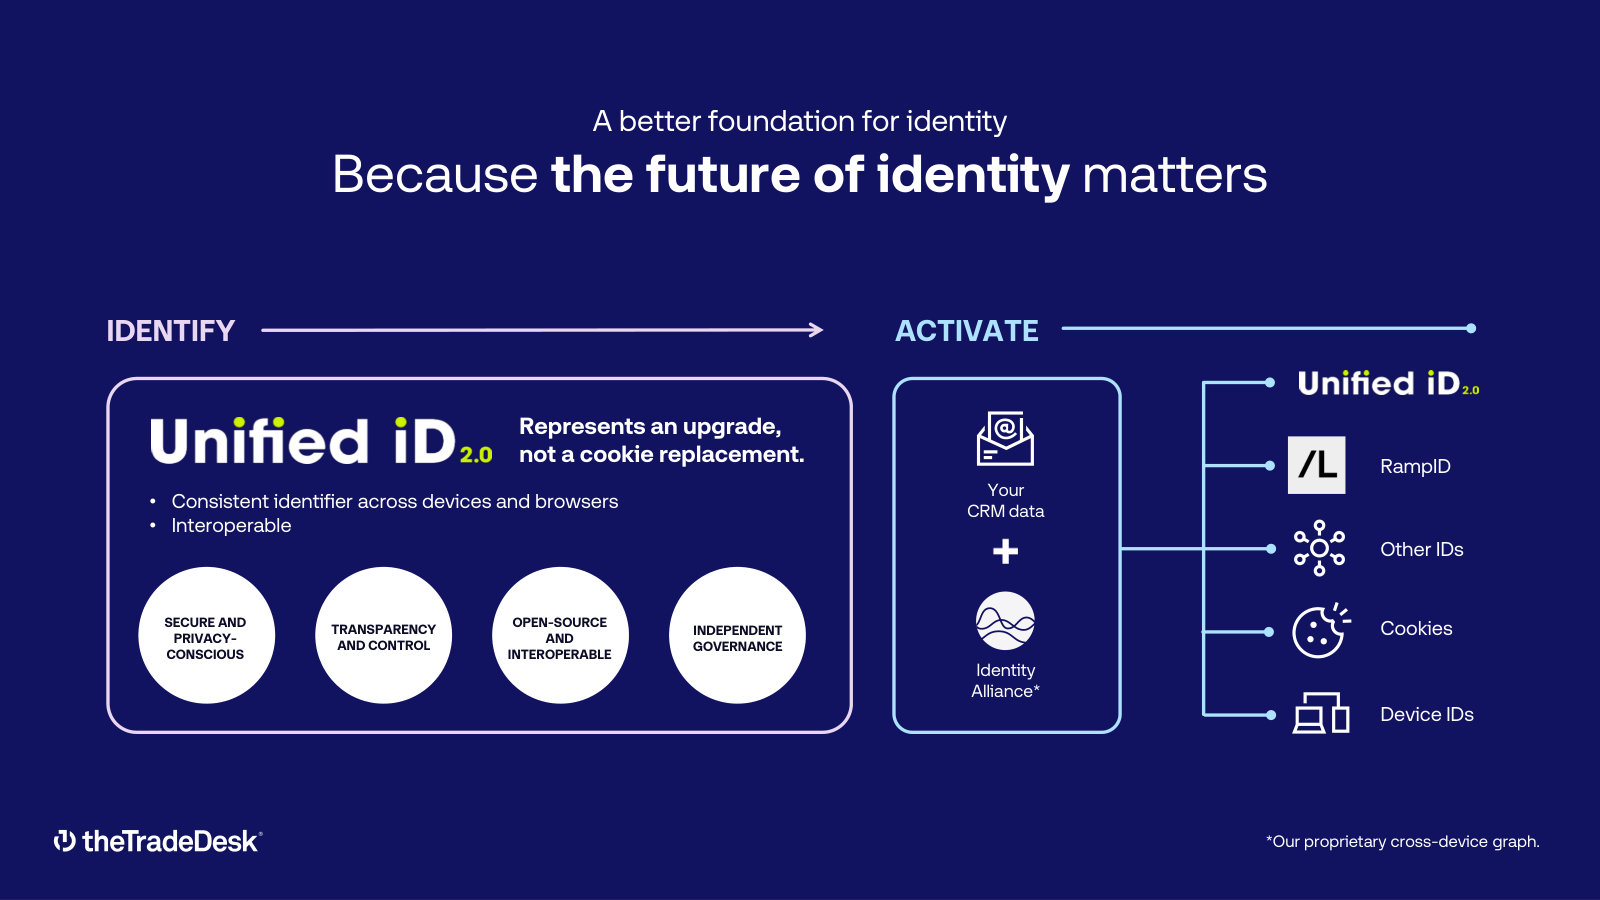
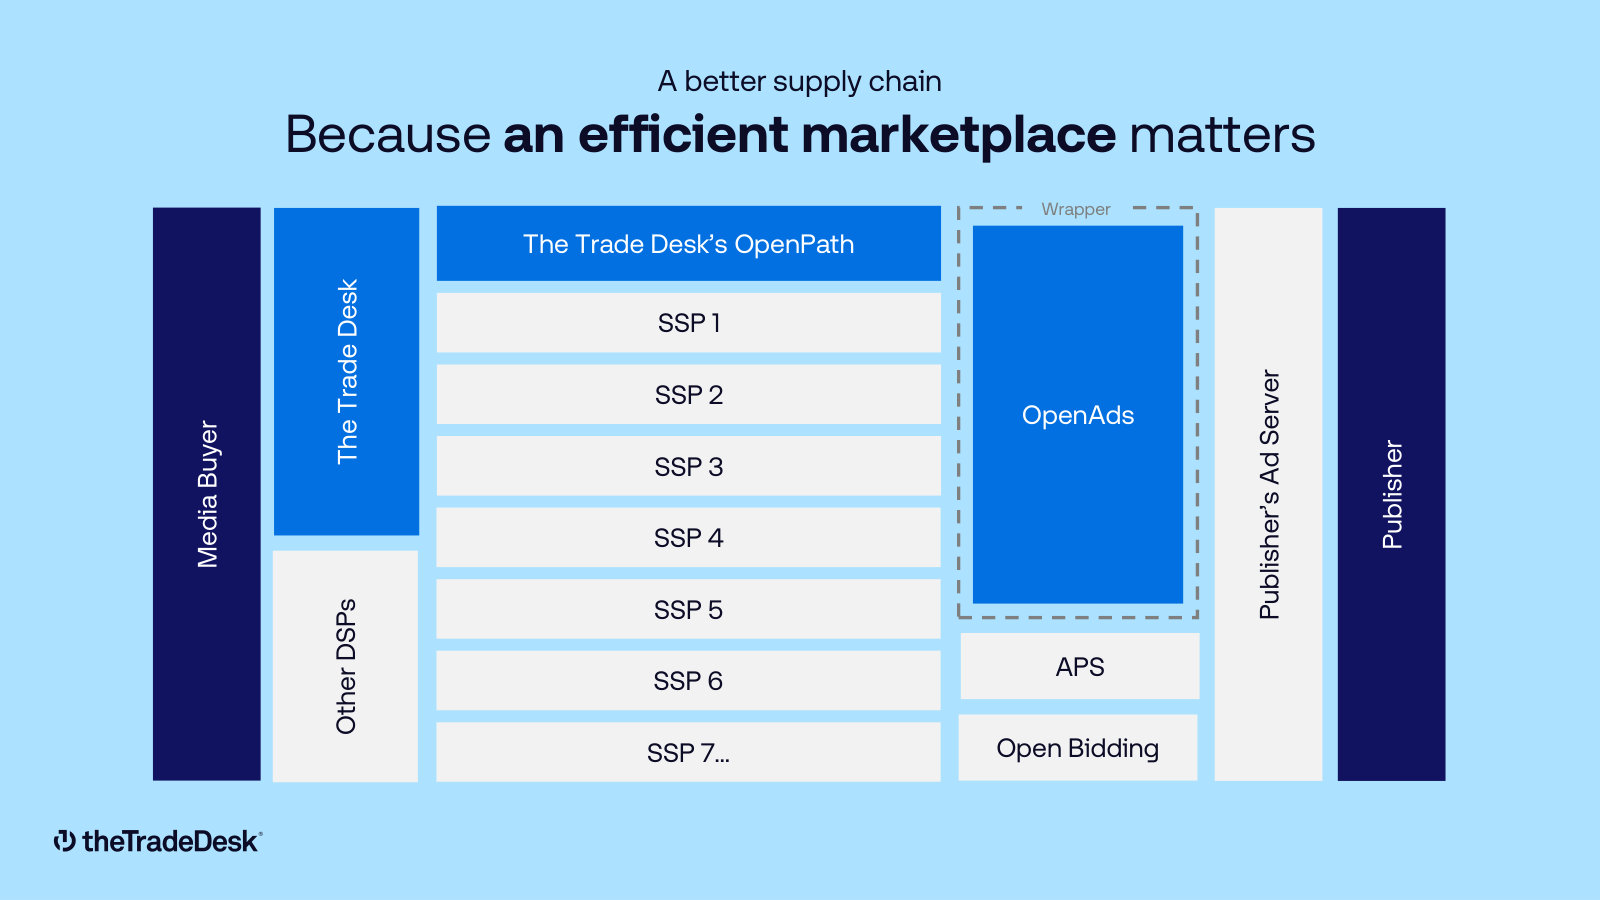
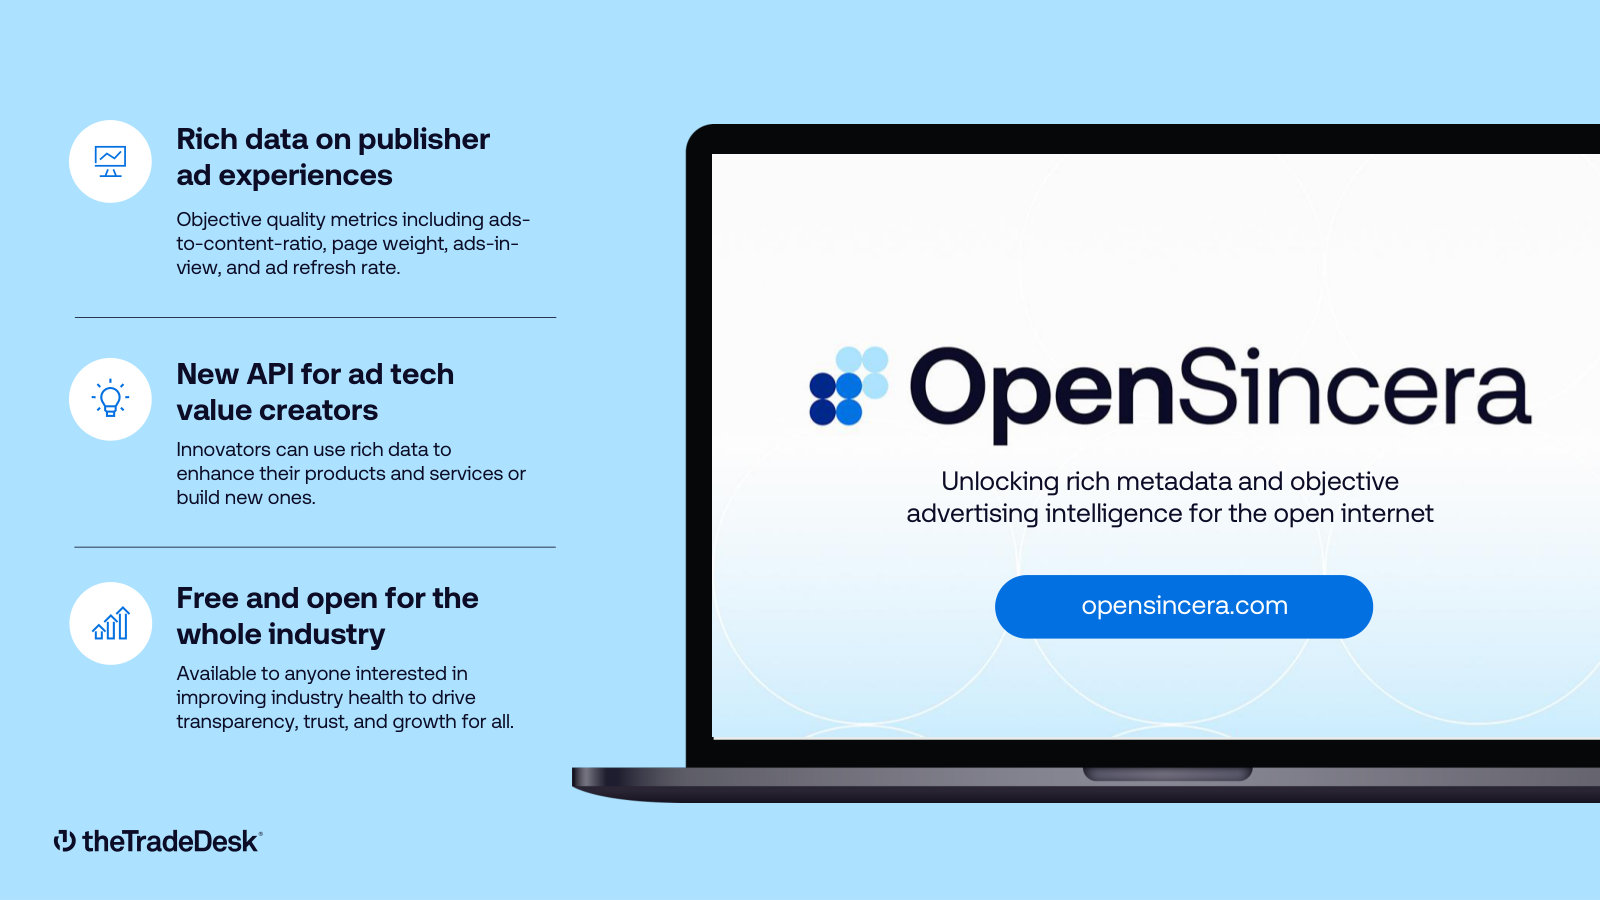
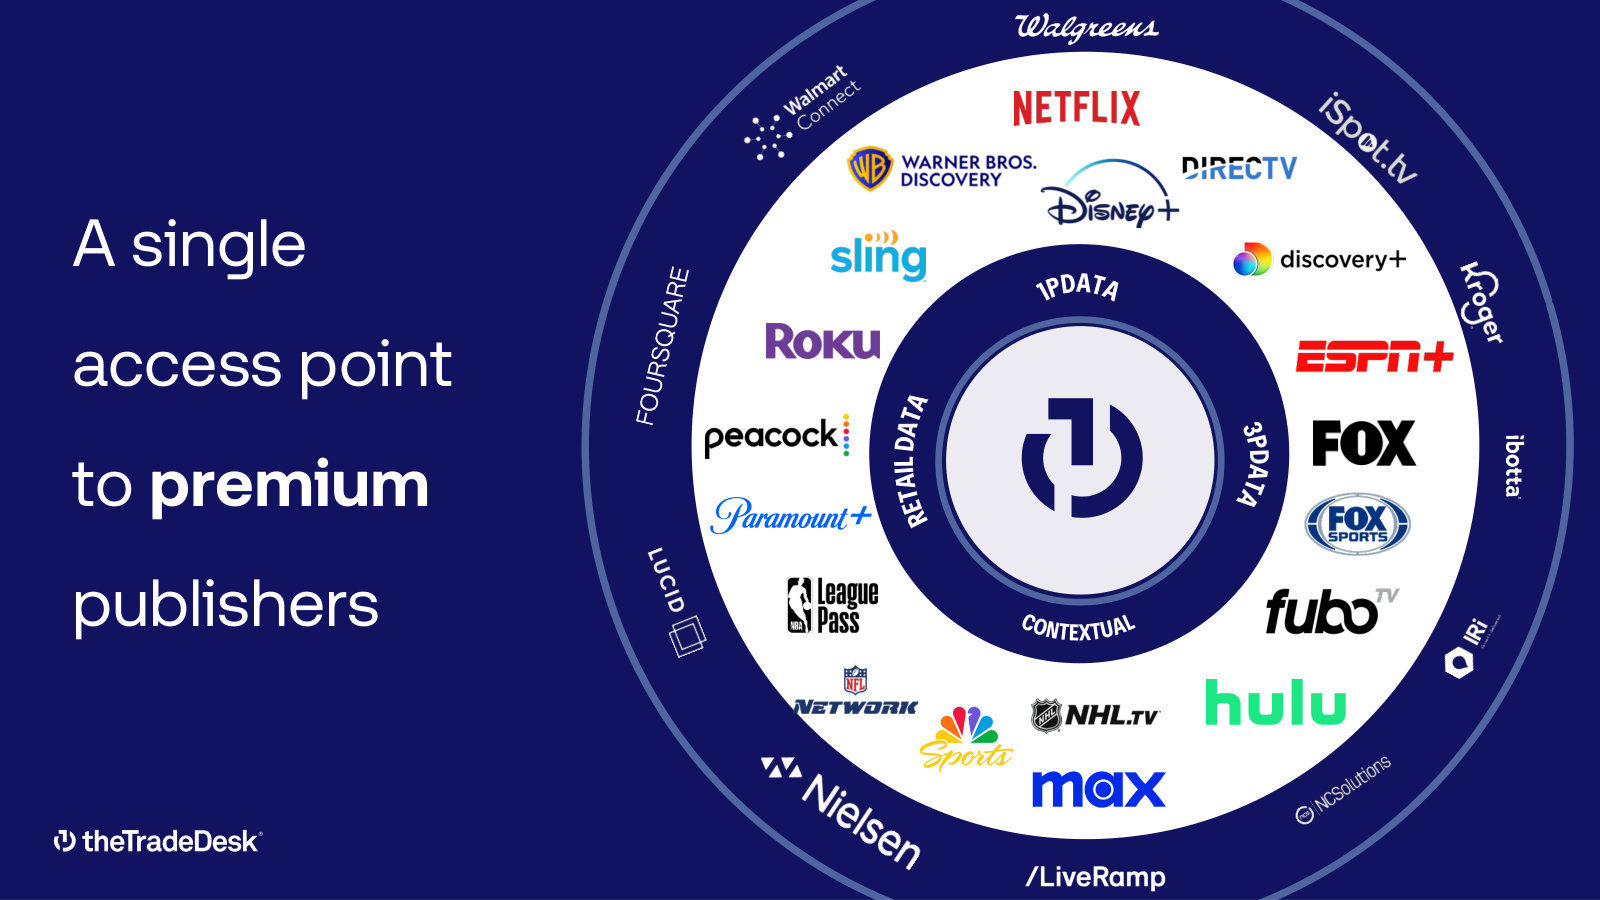
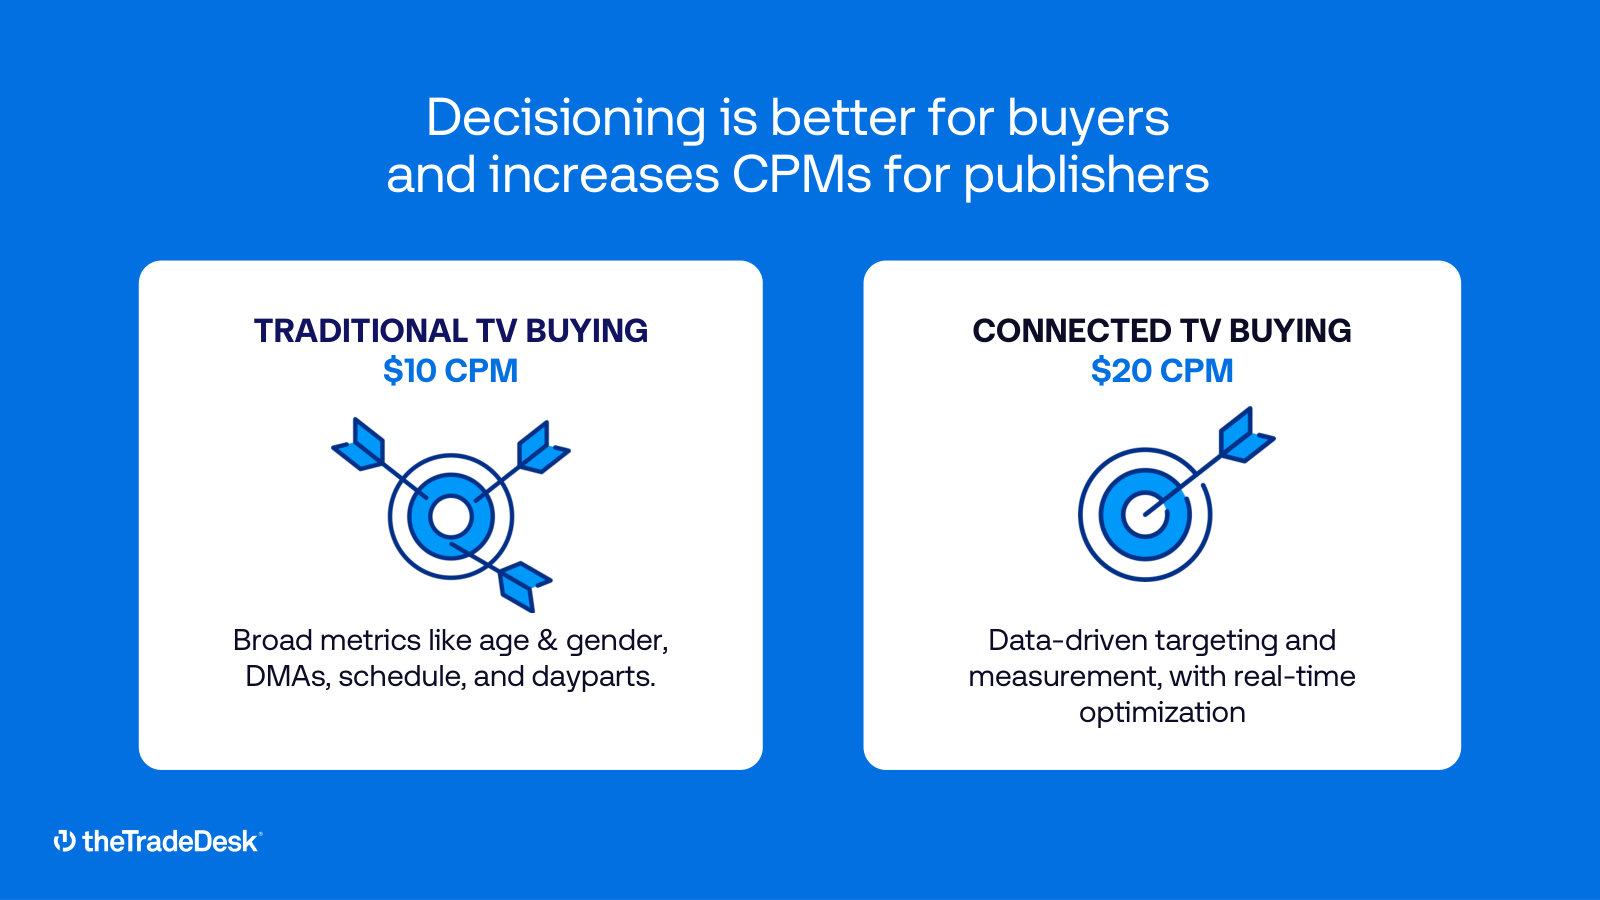
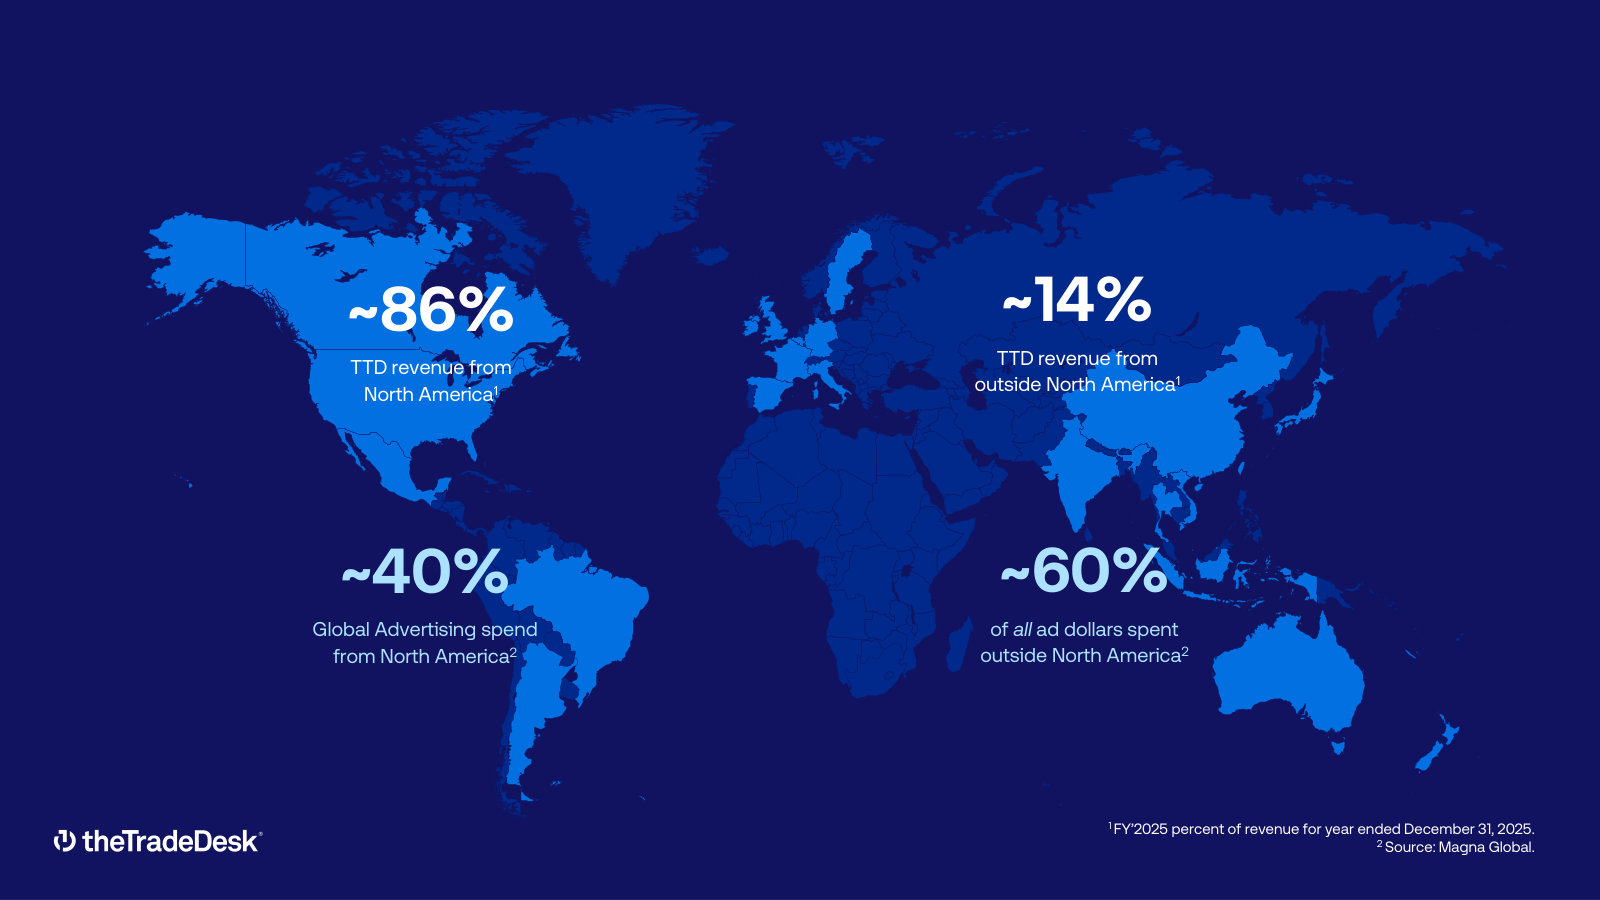
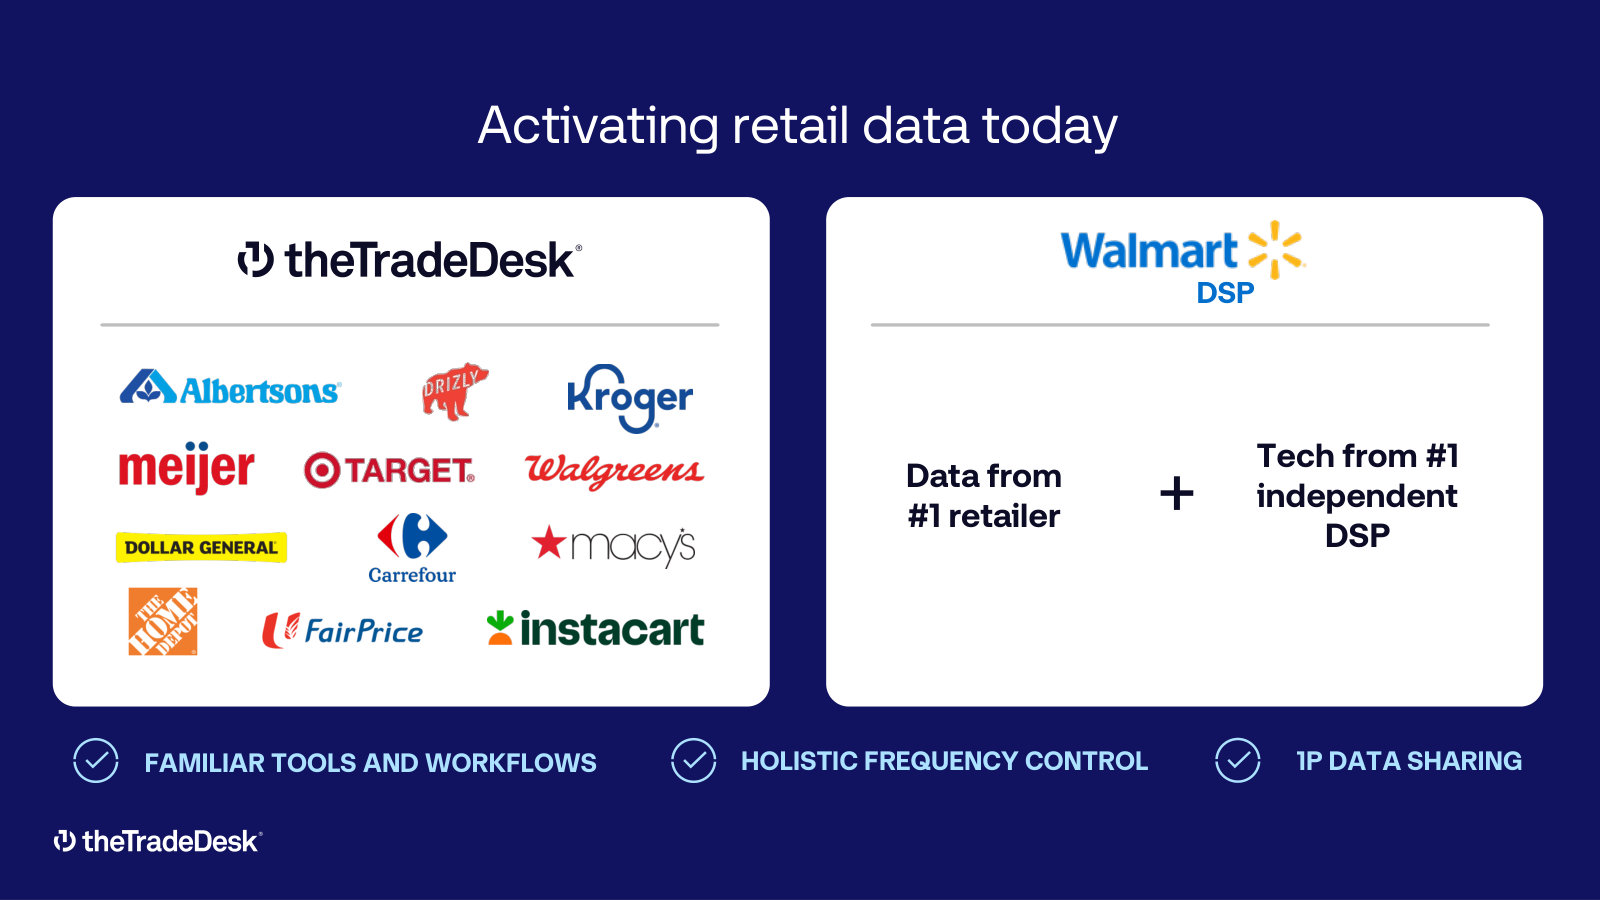
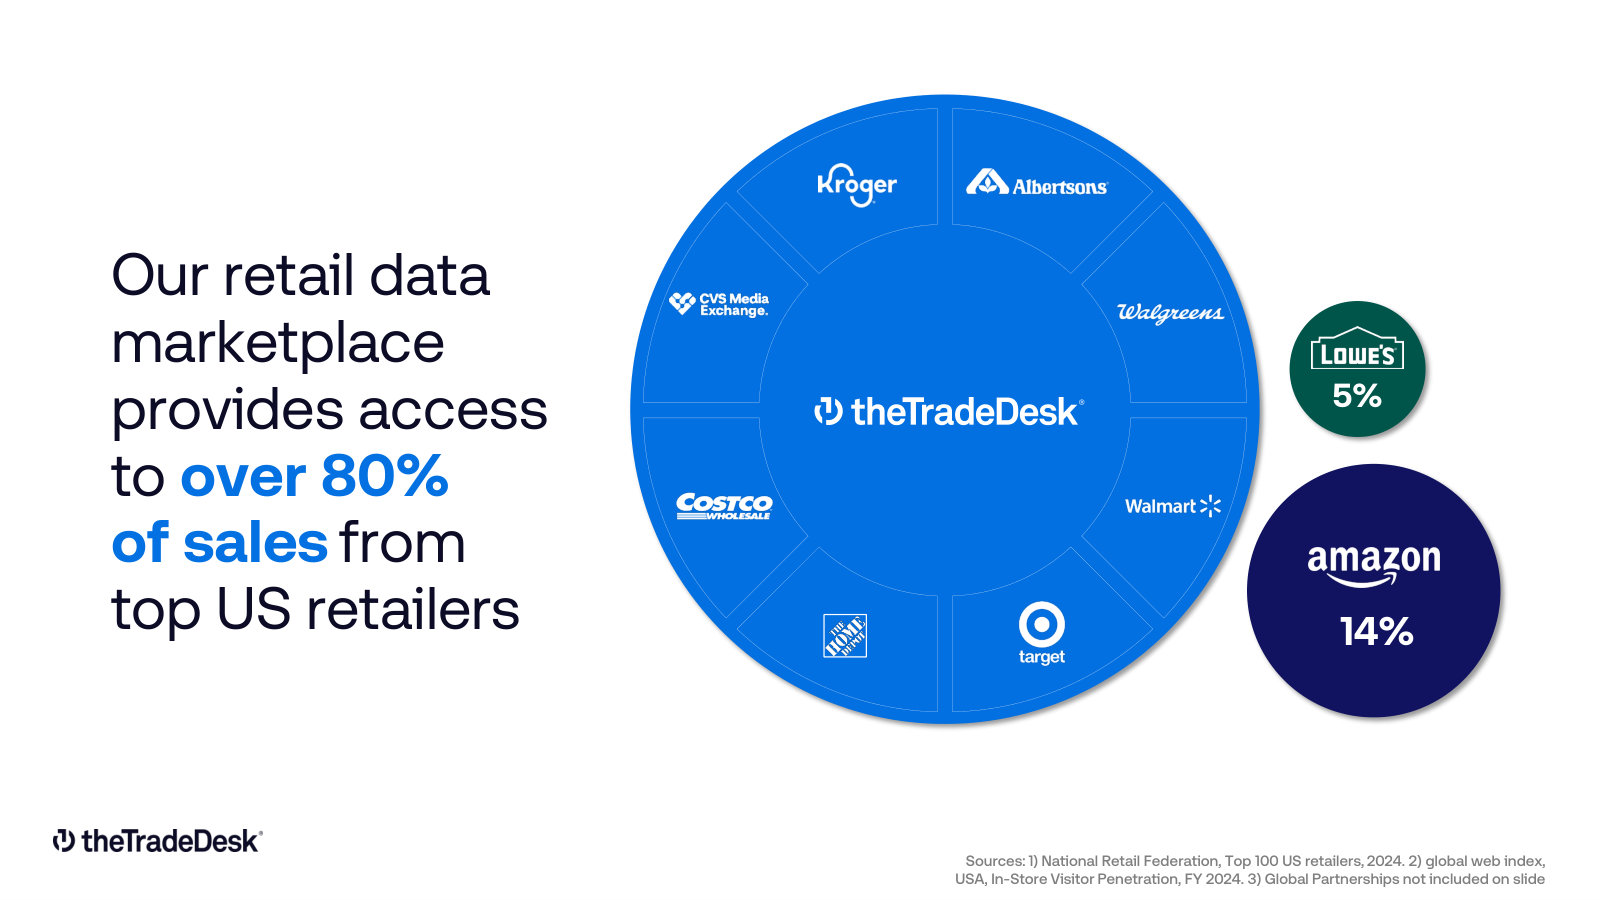
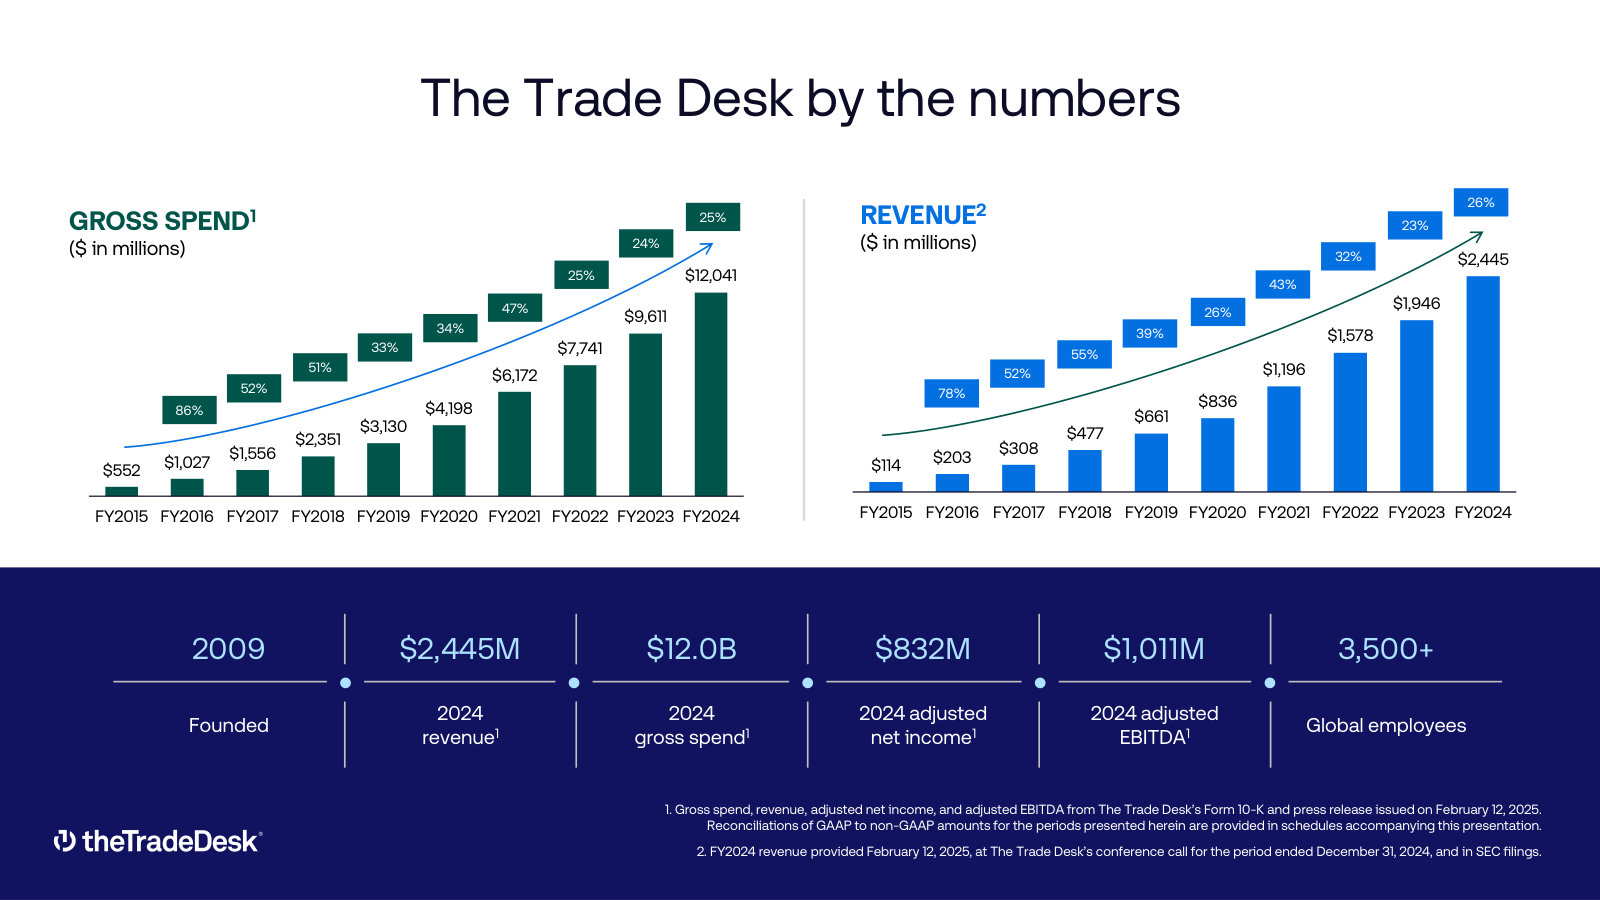
p. 4 — The buy-side positioning in one frame: objective, omnichannel, technology and measurement — why the company sits with advertisers, not inventory. · Open the full presentation →p. 6 — The Trade Desk by the numbers — revenue growth 2015–2025 with founding date, headcount, net income and free cash flow. · Open the full presentation →p. 10 — The $1T+ advertising market split into Search, Social, Traditional Media and the ~$280B Open Internet the company addresses. · Open the full presentation →p. 12 — Where a DSP sits in the value chain — advertiser dollars flowing through the buy-side to publishers, with waste squeezed out. · Open the full presentation →p. 13 — A look at the actual product: the self-serve campaign console agencies and brands operate. · Open the full presentation →p. 14 — "We buy the whole internet" — the breadth of premium supply, from Netflix and Disney+ to Spotify and Walmart. · Open the full presentation →p. 18 — The third-party data marketplace — the measurement and audience providers advertisers plug in to target and verify. · Open the full presentation →p. 19 — Spend diversified across verticals (2024 vs 2025), showing no single industry dominates revenue. · Open the full presentation →p. 20 — Global footprint — offices and engineering across NAMER, EMEA and APAC, over 3,800 employees in 35+ markets. · Open the full presentation →p. 22 — "Data management platform first" — the funnel of first-, third- and proprietary data feeding decisioning; the buyer with the most data bids best. · Open the full presentation →p. 24 — The core technical differentiator: bid factors versus rivals' line items, enabling finer optimization and reporting. · Open the full presentation →p. 25 — The targeting toolkit — first-party data, viewership, behavioral, retargeting, content signals, geo/time and cross-device. · Open the full presentation →p. 26 — Reporting depth — 200+ performance measures across 300+ variables, shown in the live reporting UI. · Open the full presentation →p. 28 — Unified ID 2.0 — the open identity standard the company backs, spanning identify-and-activate across CRM data, cookies and device IDs. · Open the full presentation →p. 29 — OpenPath and the supply-chain diagram — how the company shortens the path between media buyer and publisher. · Open the full presentation →p. 30 — OpenSincera — the free publisher-transparency data service that underpins the "objective and transparent" positioning. · Open the full presentation →p. 34 — Connected TV: a single access point to premium streaming publishers — Netflix, Disney+, Roku, Hulu, Paramount+ and more. · Open the full presentation →p. 35 — Why CTV matters to the model — data-driven buying roughly doubles CPMs ($10 to $20) versus traditional TV. · Open the full presentation →p. 38 — The international opportunity — ~86% of revenue is North America while ~60% of global ad spend sits outside it. · Open the full presentation →p. 40 — Shopper marketing in practice — activating retail data from Walmart, Kroger, Target and others alongside the DSP. · Open the full presentation →p. 41 — The retail data marketplace reaches over 80% of sales from top US retailers — the scale behind the shopper-marketing push. · Open the full presentation →
The fuller prior edition — kept for the financial-model charts, the profitability history and the platform-mechanics slides the current deck later trimmed. · Open the full document →
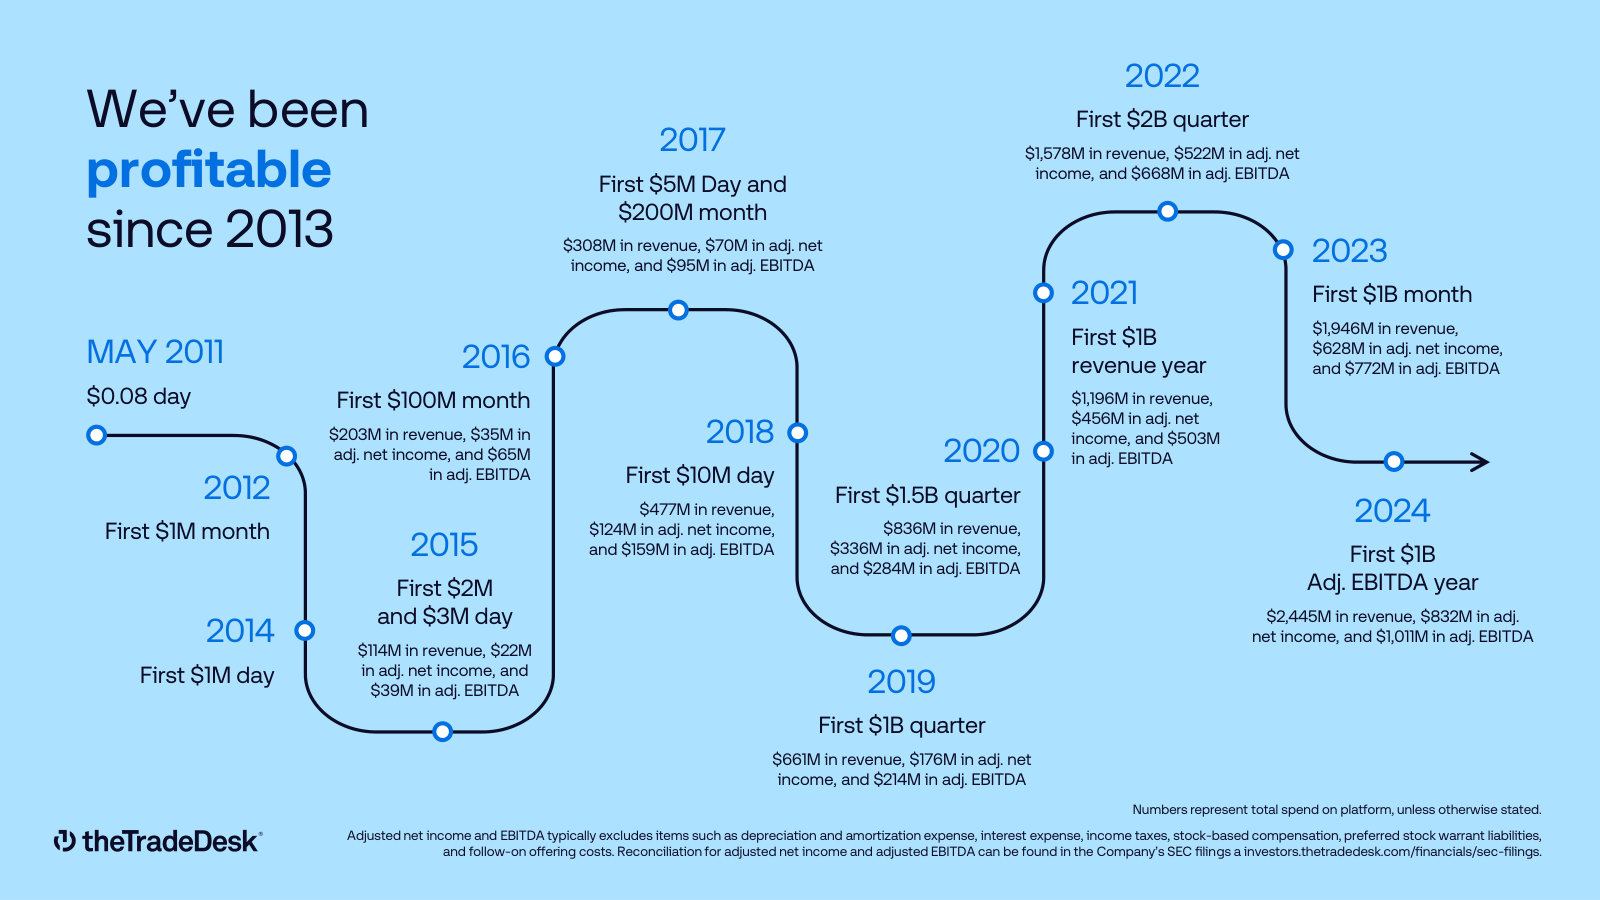
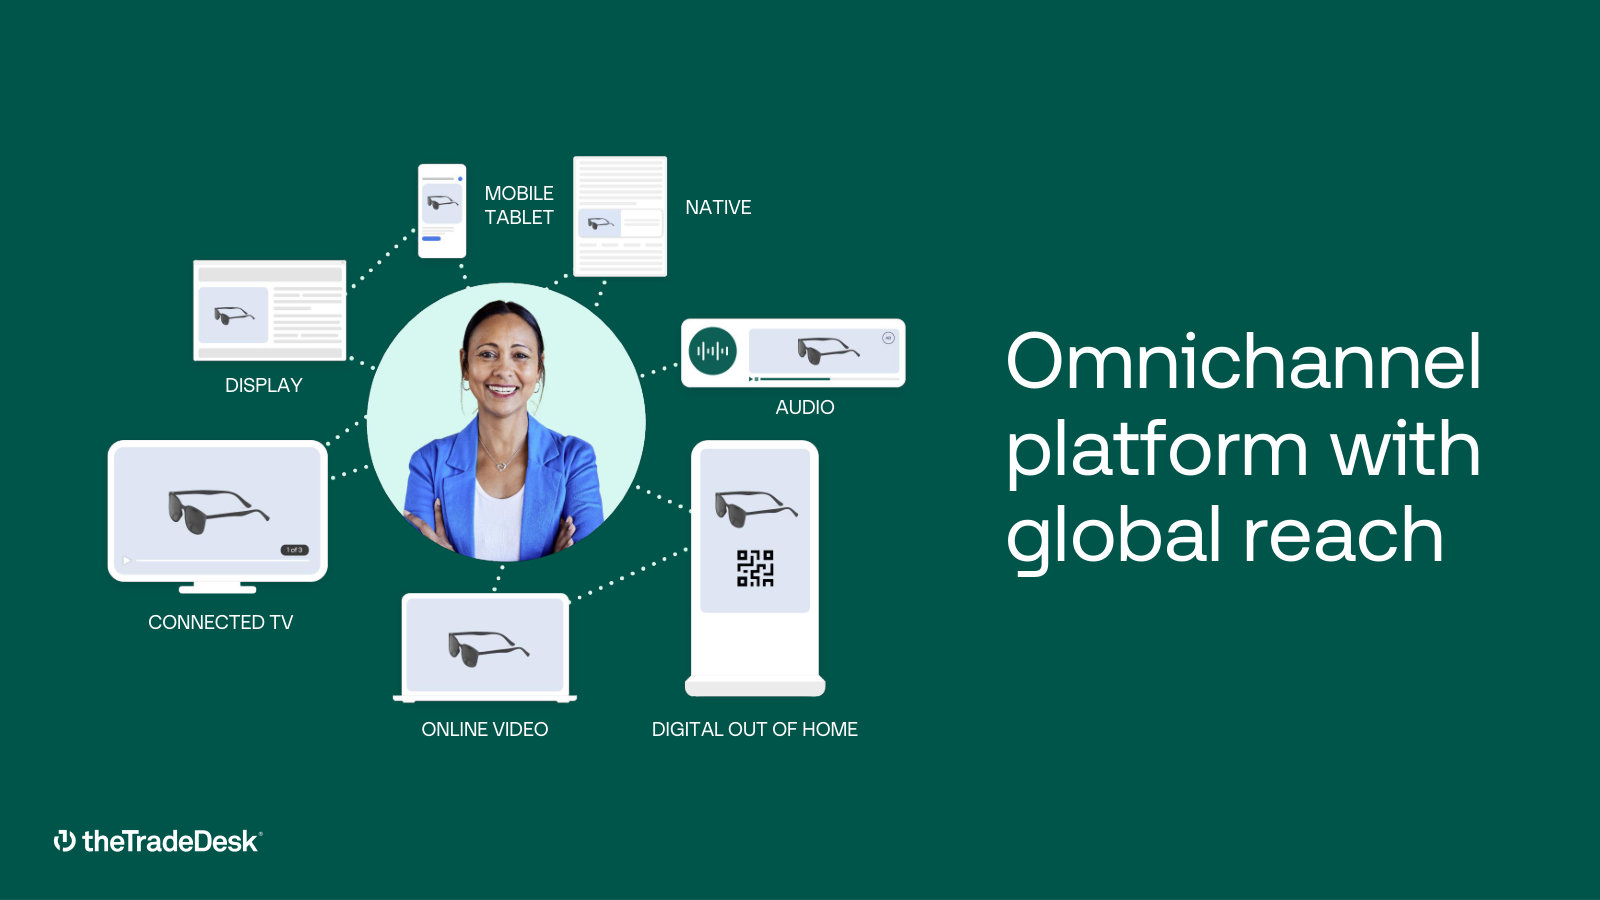
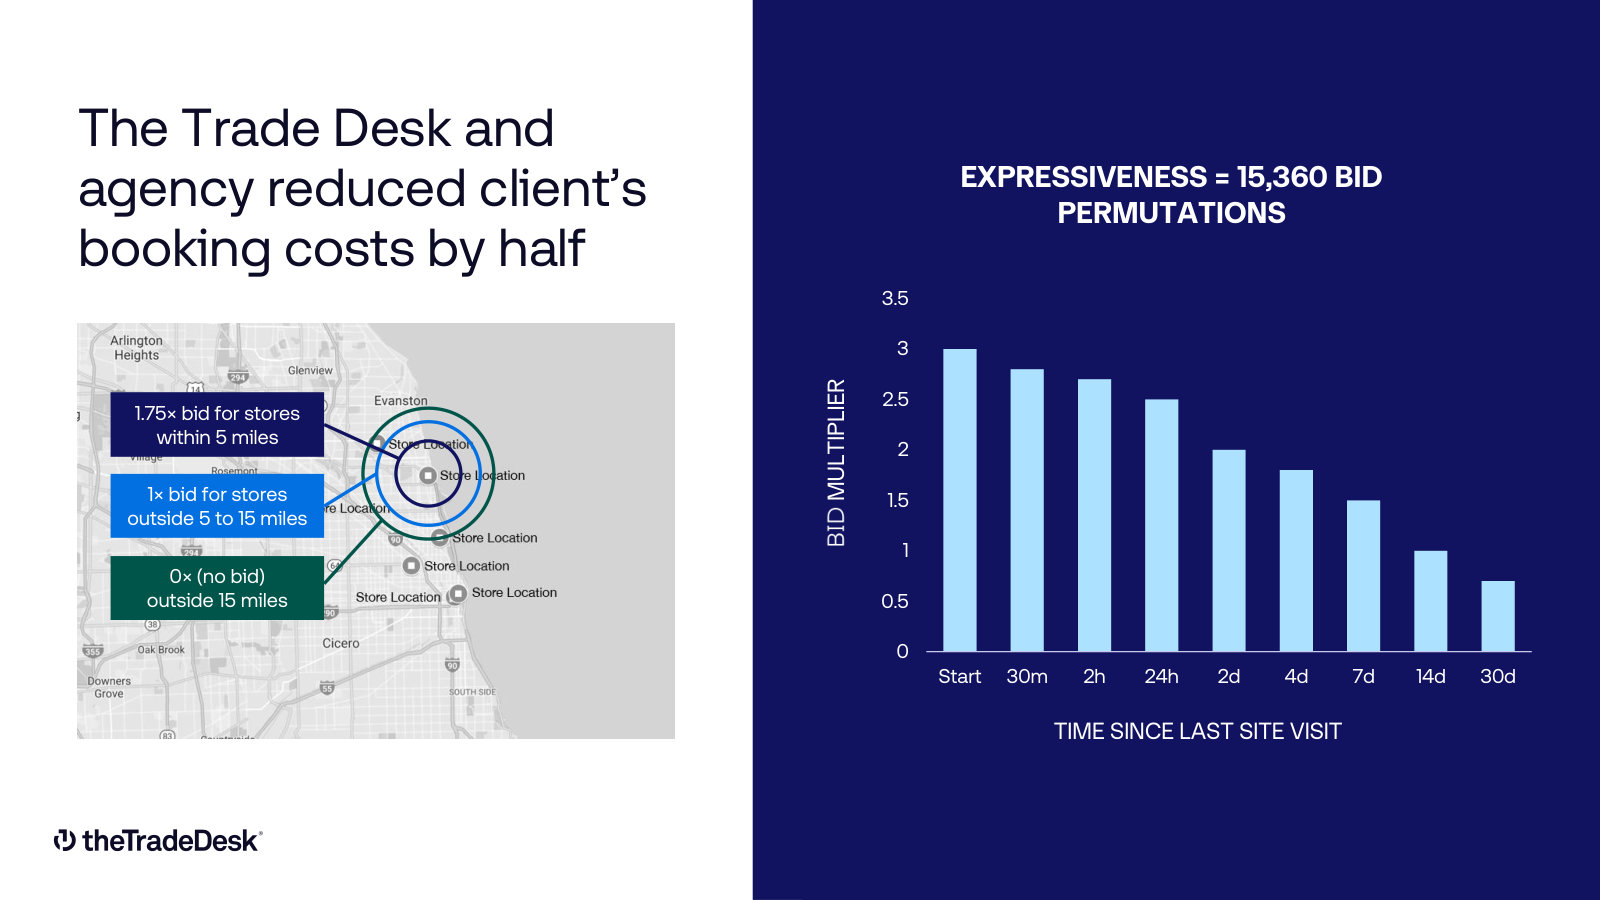
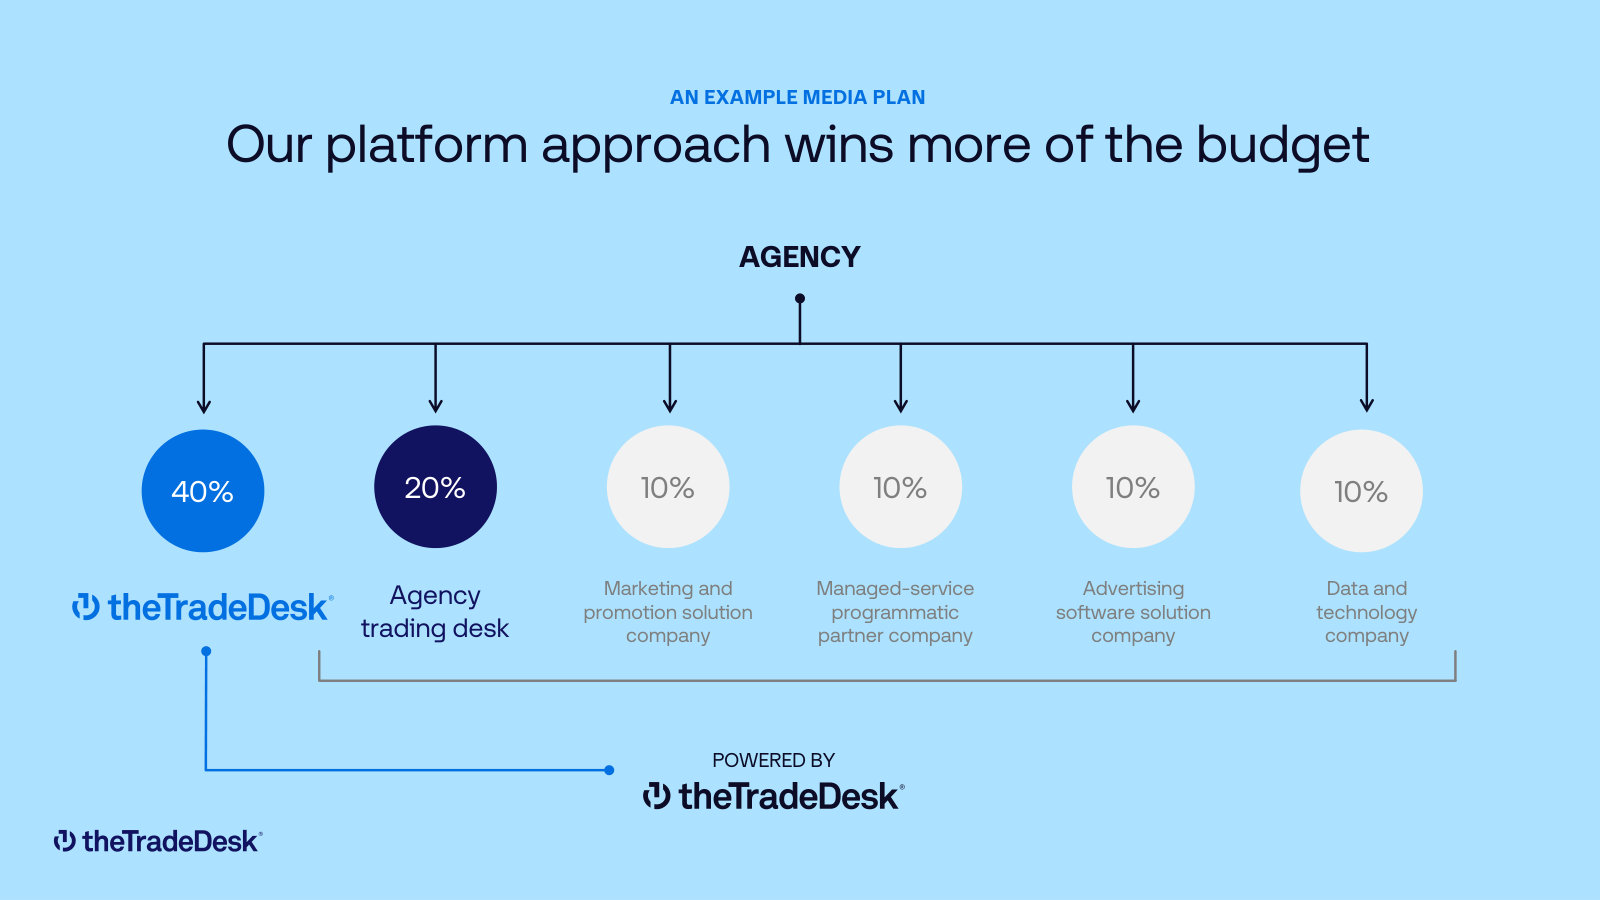
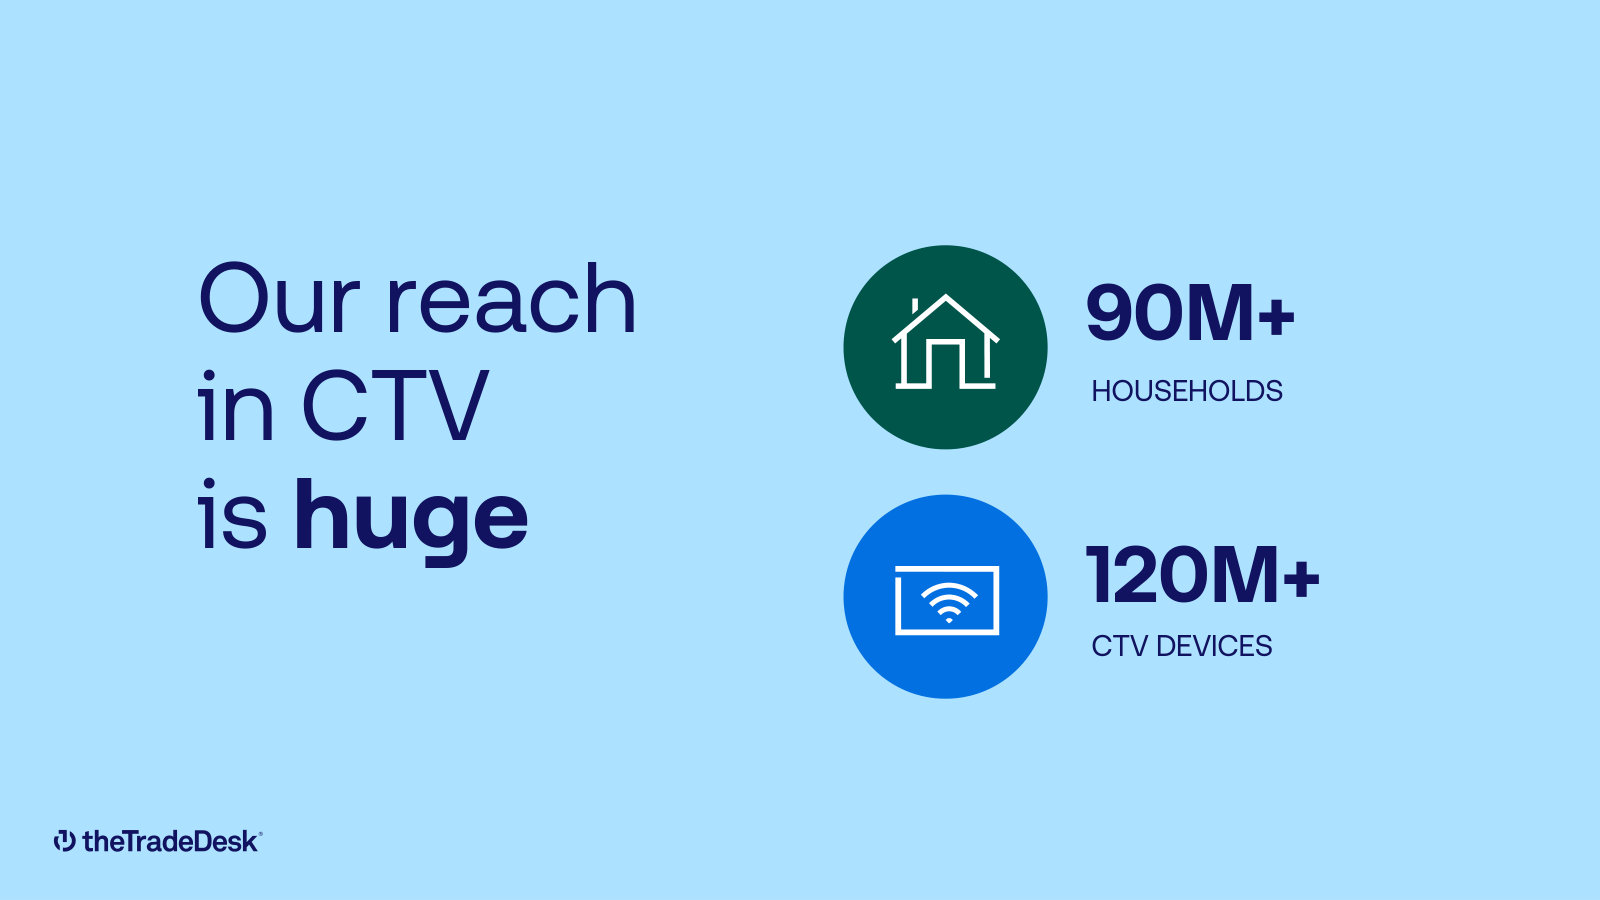
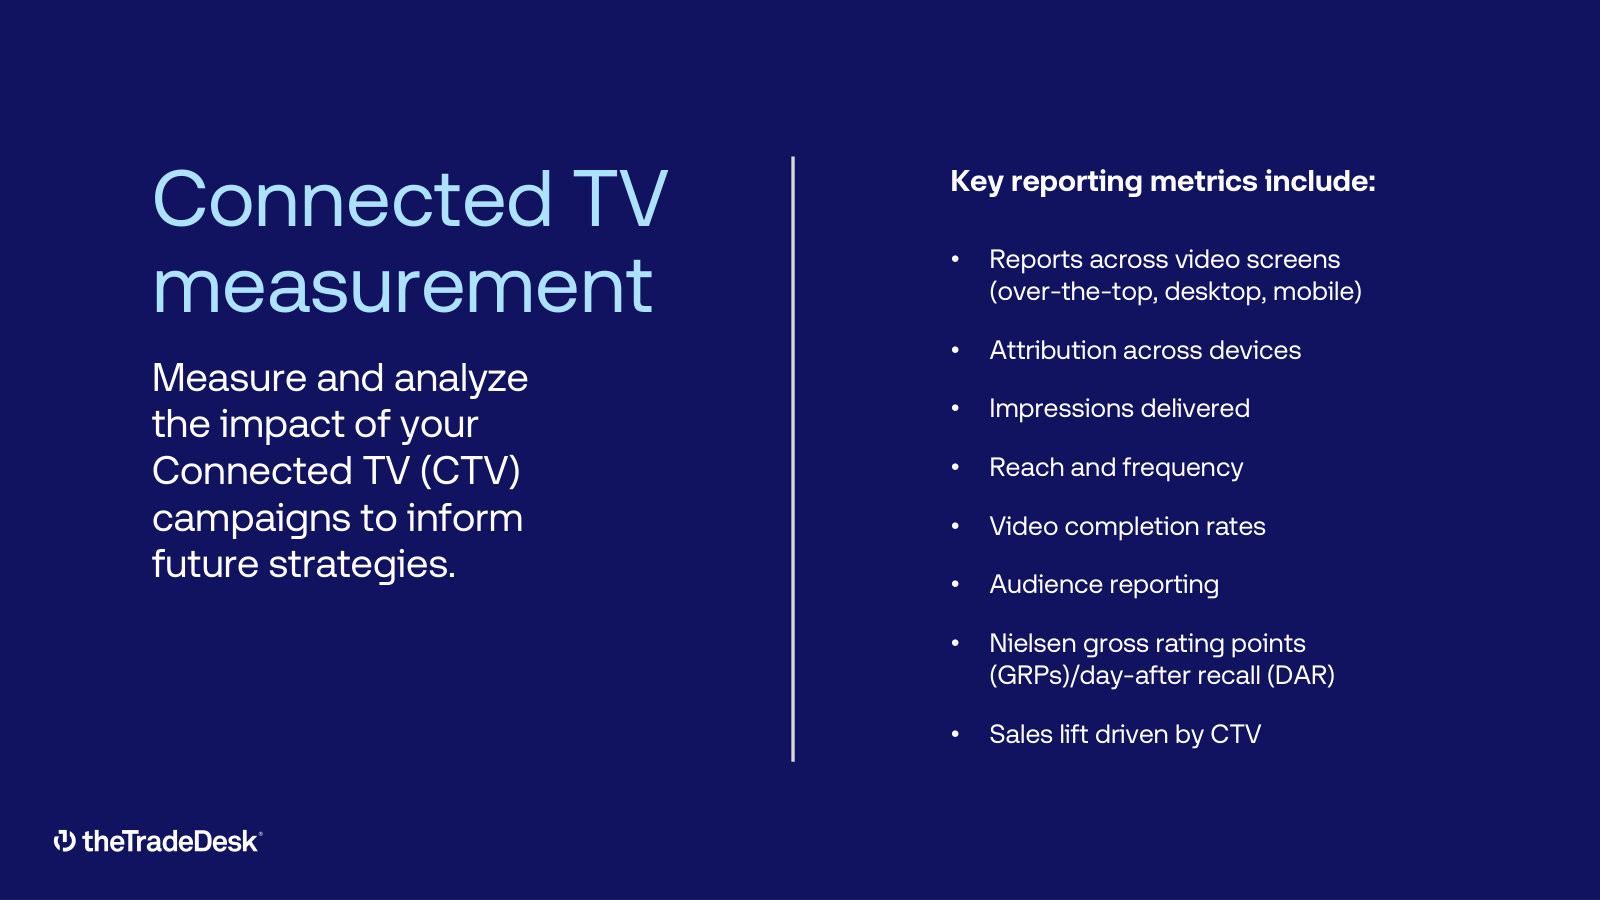
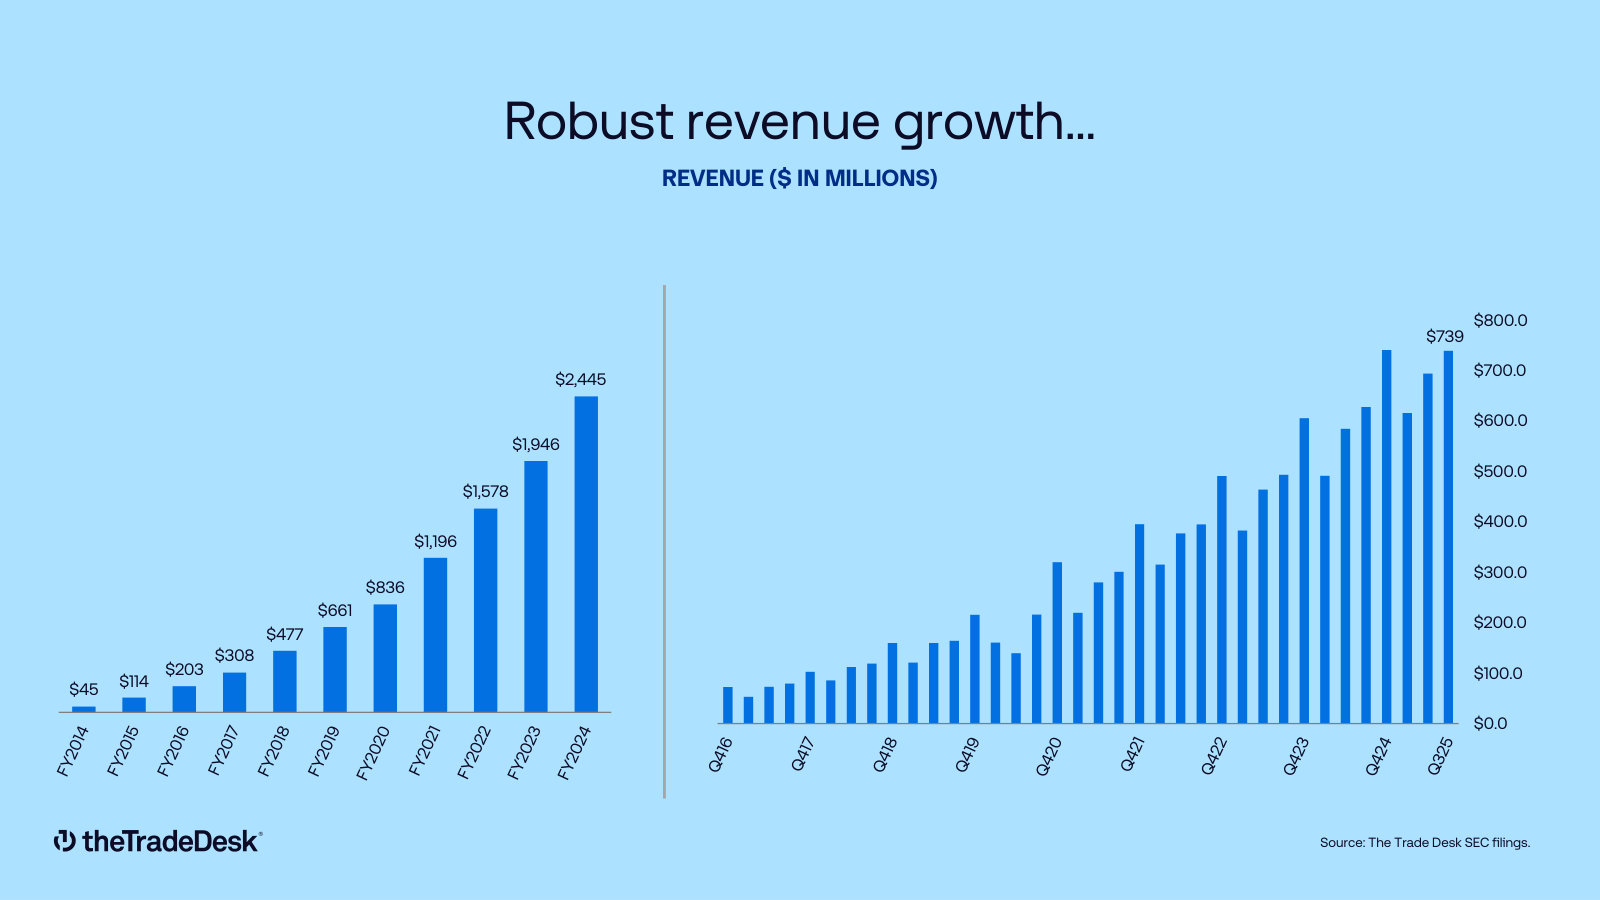
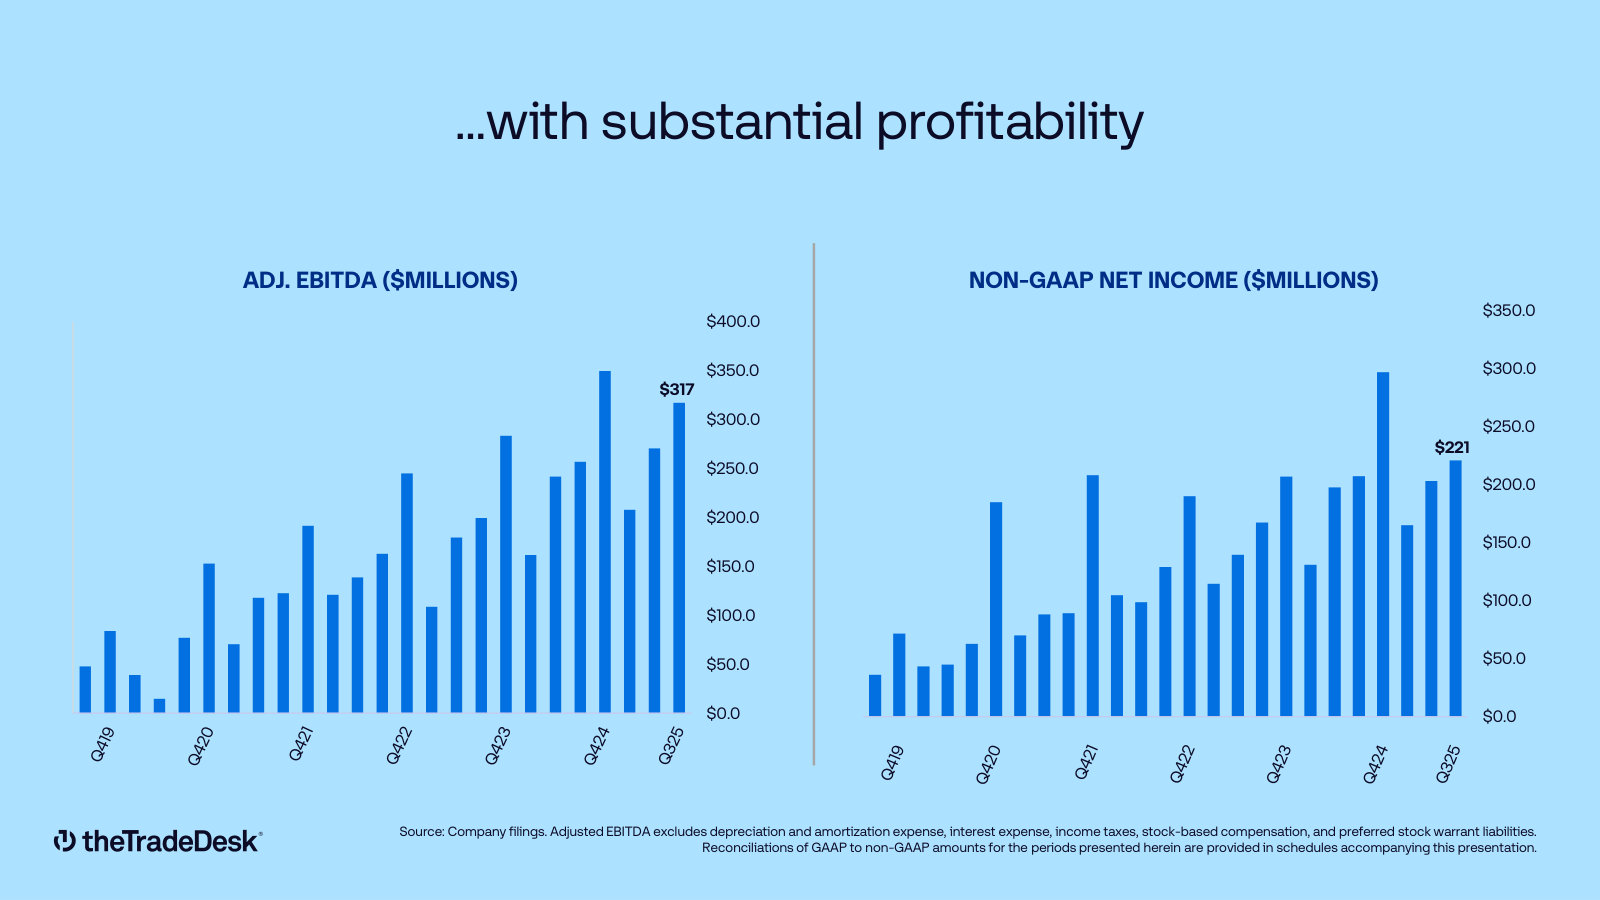
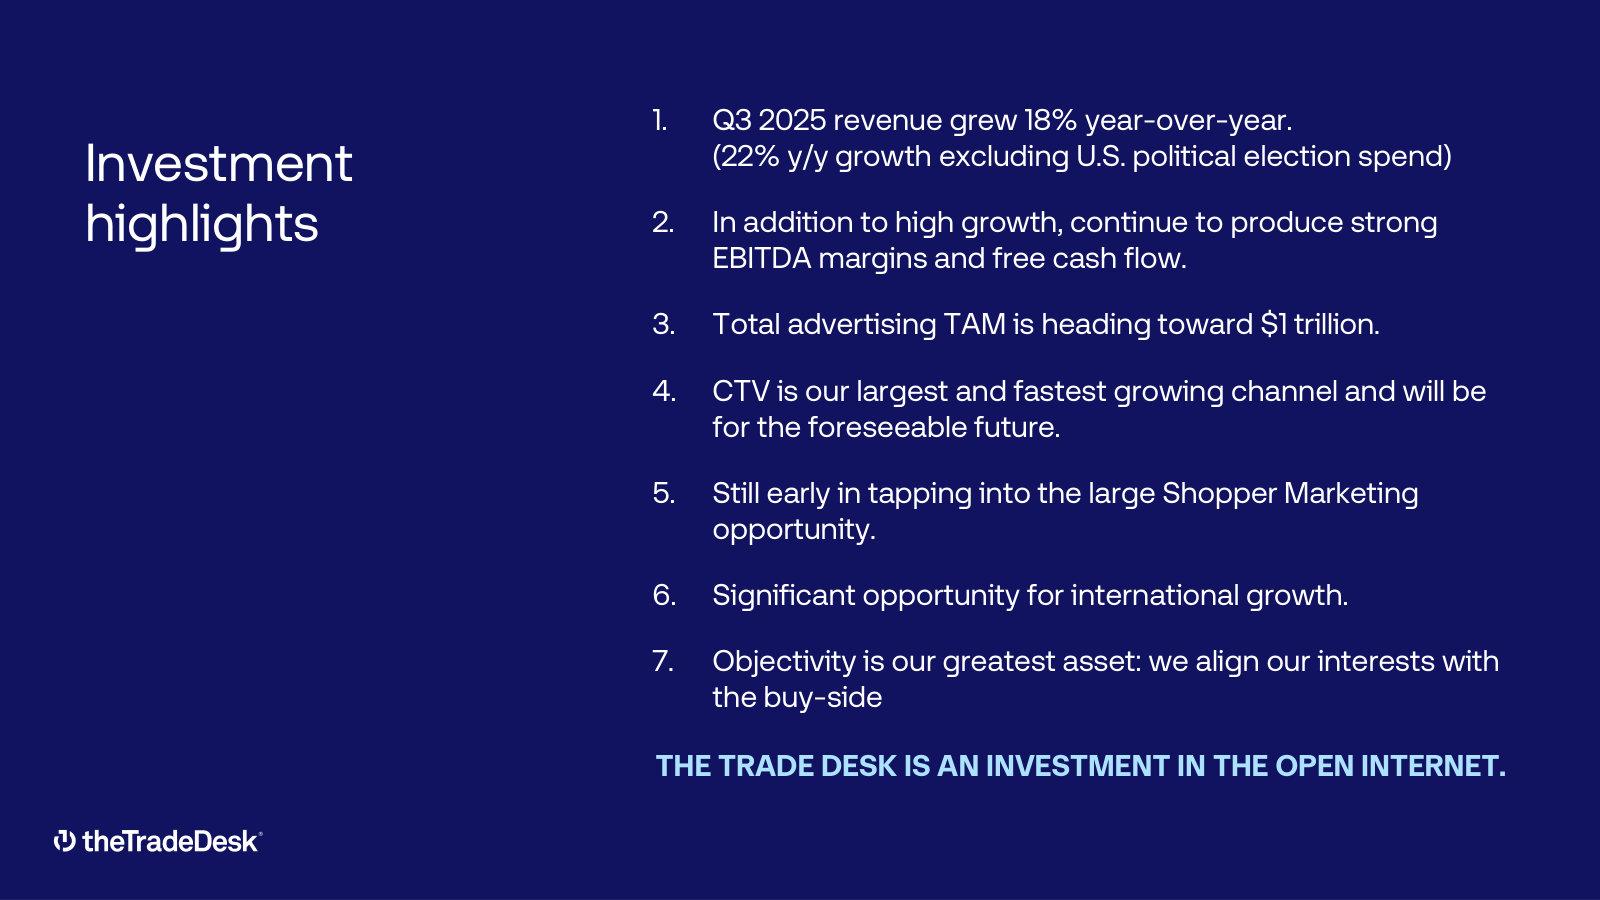
p. 4 — Profitable since 2013 — the milestone timeline from a $0.08 day in 2011 to a $1B adjusted-EBITDA year in 2024. · Open the full presentation →p. 5 — The take-rate model made explicit — gross spend on platform (~$12B) versus revenue (~$2.4B), side by side. · Open the full presentation →p. 15 — The omnichannel platform in one diagram — one console buying CTV, display, video, audio, native and digital out-of-home. · Open the full presentation →p. 27 — Expressiveness made concrete — geo-weighted bidding cut a client's booking costs in half; a bid can flex across 15,360 permutations. · Open the full presentation →p. 28 — An example media plan — why the platform approach wins a larger share of an agency's budget than point solutions. · Open the full presentation →p. 35 — CTV reach — 90M+ households and 120M+ connected-TV devices addressable through the platform. · Open the full presentation →p. 37 — Connected TV measurement — the metrics (attribution, completion, GRPs, sales lift) that make CTV accountable to buyers. · Open the full presentation →p. 47 — Robust revenue growth shown both annually and quarterly, exposing the seasonality the annual chart hides. · Open the full presentation →p. 48 — Substantial profitability — quarterly adjusted EBITDA and non-GAAP net income trends. · Open the full presentation →p. 49 — The investment thesis in seven bullets — growth, margins, $1T TAM, CTV, shopper, international and objectivity. · Open the full presentation →
Investor Relations Presentation (Q4/FY2025) — Q4 2025 · 48 pages · The full-year FY2025 edition — the version that framed the annual results the current deck now updates. · Open →
Investor Relations Presentation (Q4/FY2023) — Q4 2023 · 51 pages · How the market-size framing and CTV story looked two years earlier, before the retail-data and OpenSincera additions. · Open →
Investor Relations Presentation (Q2 2023) — Q2 2023 · 52 pages · The oldest edition in the set — the earlier version of the same pitch, useful for tracking how the equity story evolved. · Open →