Full Report
The numbers behind The Trade Desk, Inc.: as-reported financial statements and company metrics for FY2021–FY2025, traced to the source filings, opened with the share-price history those statements have to justify. Every linked figure opens the exact page of the filing it was printed on, with the statement row highlighted. Amounts in US$ thousands unless noted.
Reading notes: All figures are in thousands of U.S. dollars, as printed in the filings (10-K units line: 'In thousands, except per share amounts'). Per-share and share-count rows are stated per the filings. Each fiscal year in the main statements is cited to that year's own Form 10-K (current-year column). Revenue by geography is shown on a revenue basis, which the company reports only for FY2023–FY2025 (FY2025 Form 10-K, Note 12); the FY2023 and FY2024 10-Ks disclosed geography on a gross-billings basis, and the FY2025 10-K recast FY2023–FY2024 to the revenue basis. FY2021–FY2022 revenue-basis geography is not disclosed, so only total revenue is shown for those years. The Trade Desk operates as a single reportable segment (self-service DSP); geography is its only revenue disaggregation.
Share Price — Full Available History — 10 Years
The stock closed at $19.53 on Jul 10, 2026 — up 6,388% over the window shown (+53.1% a year), trading between $0.23 and $139.51. At that close the stock trades at 22× FY2025 diluted EPS as reported below.
Source: market price feed, weekly closes, sampled from 2,463 source observations, Sep 2016–Jul 2026. Price return only, excludes dividends. Prices are split-adjusted (1:10 on Jun 17, 2021).
FY2025 at a Glance
Net income (US$ thousands)
Diluted EPS
Source: FY2025 consolidated statements [1] [2] [3] [4]. Click any linked figure to open the filing page with the row highlighted.
Revenue by Geography
| Revenue by Geography | FY2021 | FY2022 | FY2023 | FY2024 | FY2025 |
|---|---|---|---|---|---|
| United States | — | — | 1,696,911 | 2,133,502 | 2,476,683 |
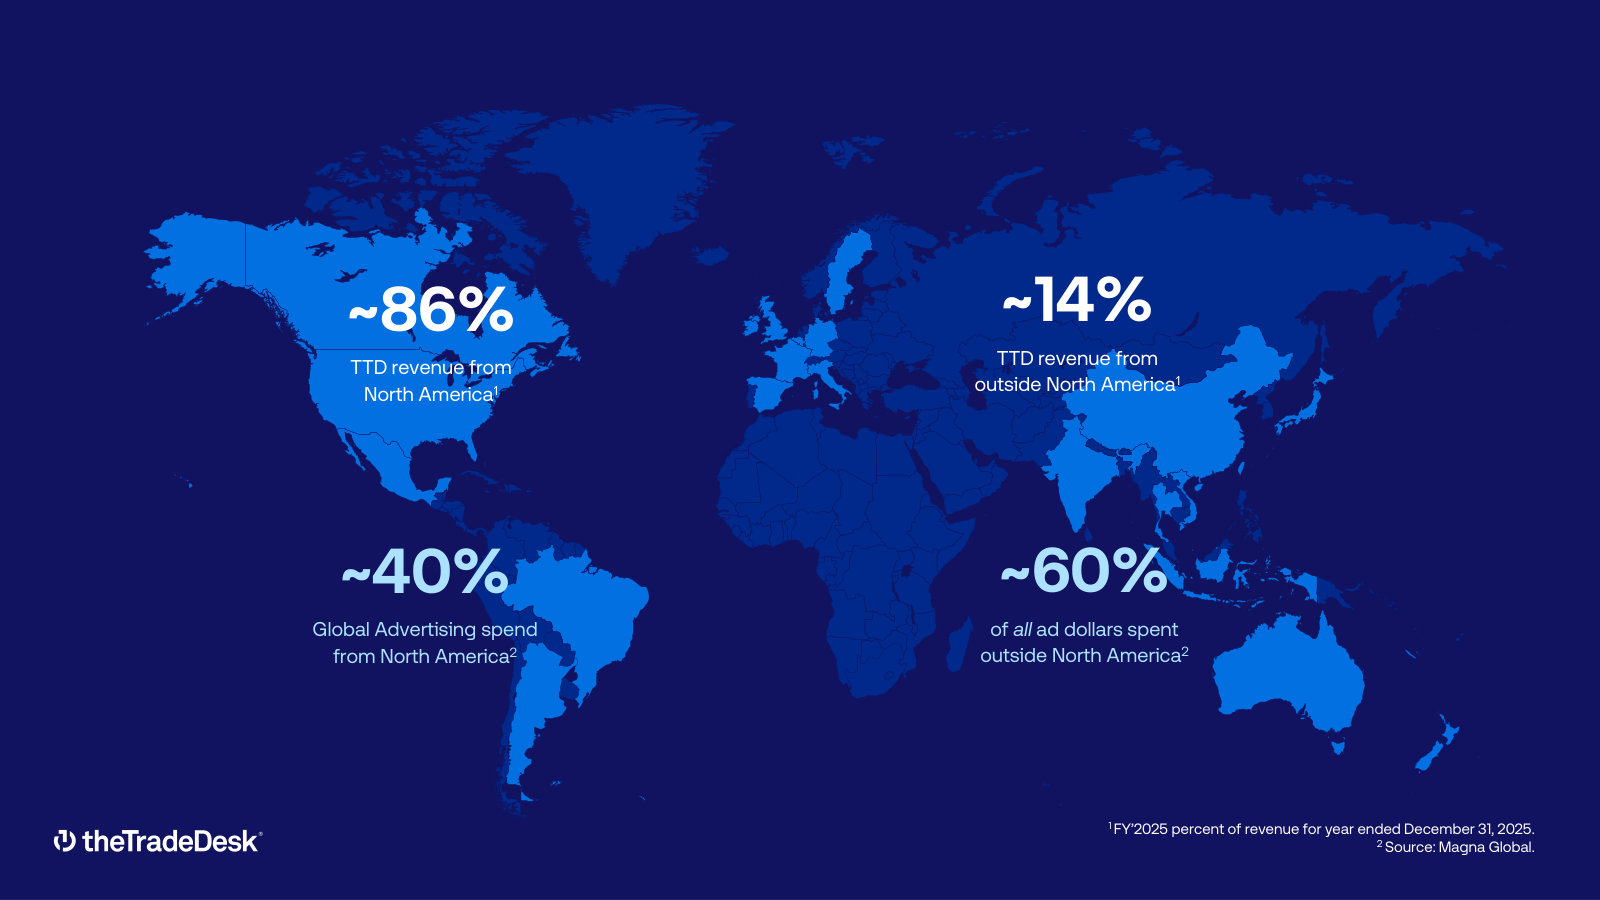
| International | — | — | 249,209 | 311,329 | 419,601 |
| Total revenue | 1,196,467 | 1,577,795 | 1,946,120 | 2,444,831 | 2,896,284 |
| Total revenue growth, derived | — | +31.9% | +23.3% | +25.6% | +18.5% |
Source: Revenue by principal geographic area (revenue basis), Note 12 — Segment and Geographic Information; total ties to Consolidated Statements of Operations [5] [4] [6]. Click any linked figure to open the filing page with the row highlighted.
Income Statement
Source: Consolidated Statements of Operations [1] [2] [3] [4]. Click any linked figure to open the filing page with the row highlighted.
Columns marked E are consensus analyst estimates shown alongside reported results for direct comparison; they are not company guidance.
Estimate source: Yahoo Finance analyst consensus, as of 2026-07-11. Estimate figures link to the consensus source, not to filing pages.
Balance Sheet
Source: Consolidated Balance Sheets [7] [8] [9] [10]. Click any linked figure to open the filing page with the row highlighted.
Cash Flow
Source: Consolidated Statements of Cash Flows [11] [12] [13] [14]. Click any linked figure to open the filing page with the row highlighted.
Platform Scale, Client Spend Profitability
| Platform Scale, Client Spend Profitability | FY2021 | FY2022 | FY2023 | FY2024 | FY2025 |
|---|---|---|---|---|---|
| Gross spend on platform | 6,172,000 | 7,741,000 | 9,611,000 | 12,040,872 | 13,394,683 |
| Gross spend growth (YoY) | 47.0% | 25.0% | 24.0% | 25.0% | 11.0% |
| Adjusted EBITDA | — | — | — | 1,010,649 | 1,196,449 |
| Client retention rate (over 95%) | 95.0% | 95.0% | 95.0% | 95.0% | 95.0% |
| Investment in capitalized software | 5,200 | 8,000 | 8,000 | 9,000 | 13,000 |
Source: company filings [15] [16] [17] [18]. Click any linked figure to open the filing page with the row highlighted.
Global Workforce Footprint
| Global Workforce Footprint | FY2021 | FY2022 | FY2023 | FY2024 | FY2025 |
|---|---|---|---|---|---|
| Full-time employees | 1,967 | 2,770 | 3,115 | 3,522 | 3,843 |
| Countries of operation | 19 | 19 | 19 | 20 | 21 |
| North America — % of workforce | 65.0% | 63.0% | 64.0% | 64.0% | 63.0% |
| EMEA — % of workforce | 18.0% | 19.0% | 19.0% | 19.0% | 20.0% |
| Asia Pacific — % of workforce | 17.0% | 18.0% | 17.0% | 17.0% | 17.0% |
Source: company filings [19] [20] [21] [22]. Click any linked figure to open the filing page with the row highlighted.
Long-Term Record
| Fiscal year | Total revenue | Income from operations | Net income | Diluted earnings per share | Net cash provided by operating activities |
|---|---|---|---|---|---|
| FY2016 | 202,926 | 57,518 | 20,482 | — | 75,031 |
| FY2017 | 308,217 | 69,356 | 50,798 | — | 31,224 |
| FY2018 | 477,294 | 107,323 | 88,140 | — | 86,603 |
| FY2019 | 661,058 | 112,196 | 108,318 | 0.23 | 60,205 |
| FY2020 | 836,033 | 144,208 | 242,317 | 0.49 | 405,069 |
| FY2021 | 1,196,467 | 124,817 | 137,762 | 0.28 | 378,513 |
| FY2022 | 1,577,795 | 113,654 | 53,385 | 0.11 | 548,734 |
| FY2023 | 1,946,120 | 200,480 | 178,940 | 0.36 | 598,322 |
| FY2024 | 2,444,831 | 427,167 | 393,076 | 0.78 | 739,456 |
| FY2025 | 2,896,284 | 589,321 | 443,304 | 0.90 | 992,721 |
Source: consolidated statements across filings; older years from the standardized feed [11] [1] [13] [3]. Click any linked figure to open the filing page with the row highlighted.
Operating KPIs
| KPI | FY2021 | FY2022 | FY2023 | FY2024 | FY2025 |
|---|---|---|---|---|---|
| Gross spend | — | — | — | 12,040,872 | 13,394,683 |
Source: company-reported operating metrics [16]. Click any linked figure to open the filing page with the row highlighted.
Analyst Consensus
Current price
Mean target
Median target
High target
Low target
Estimate source: Yahoo Finance analyst consensus, as of 2026-07-11. Estimate figures link to the consensus source, not to filing pages.
Traceability
326 of 339 figures on this page (96%) link to the filing page where they are printed — click a linked figure to open the source PDF at that page with the row highlighted. Unlinked figures come from standardized data feeds or pre-filing years.
All figures are in thousands of U.S. dollars, as printed in the filings (10-K units line: 'In thousands, except per share amounts'). Per-share and share-count rows are stated per the filings.
Each fiscal year in the main statements is cited to that year's own Form 10-K (current-year column).
Revenue by geography is shown on a revenue basis, which the company reports only for FY2023–FY2025 (FY2025 Form 10-K, Note 12); the FY2023 and FY2024 10-Ks disclosed geography on a gross-billings basis, and the FY2025 10-K recast FY2023–FY2024 to the revenue basis. FY2021–FY2022 revenue-basis geography is not disclosed, so only total revenue is shown for those years.
The Trade Desk operates as a single reportable segment (self-service DSP); geography is its only revenue disaggregation.
Long-Term Record: FY2019–FY2025 are cited to filings (FY2019–FY2020 via the FY2021 10-K comparative columns; FY2021–FY2022 via the FY2023 10-K); FY2016–FY2018 are from the standardized SEC XBRL data feed and shown without page links. Diluted EPS is shown only for FY2019 onward to keep all values on the post-split (10-for-1, June 2021) basis.
KPI 'Gross spend' is a company-reported operating metric (total client spend on the platform); FY2024–FY2025 are cited to the FY2025 10-K MD A.
Quarterly Q4 FY25 income-statement cells and Q2–Q4 FY25 cash-flow cells are derived from printed year-to-date statements (see block notes); all reconcile exactly and were cross-checked against the standardized quarterly data feed.
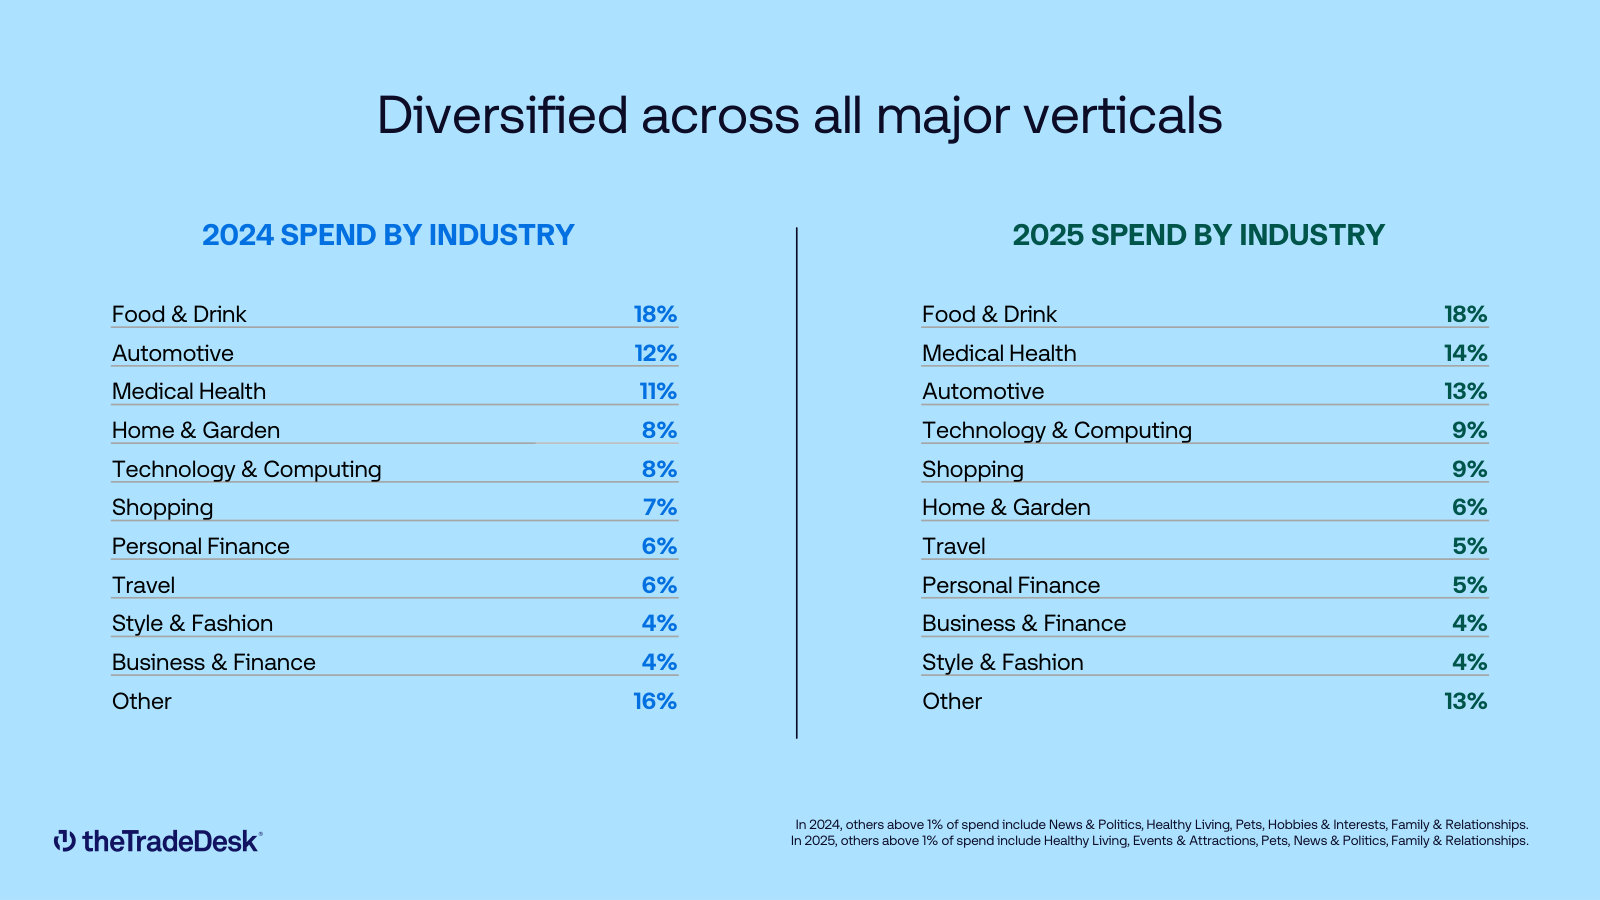
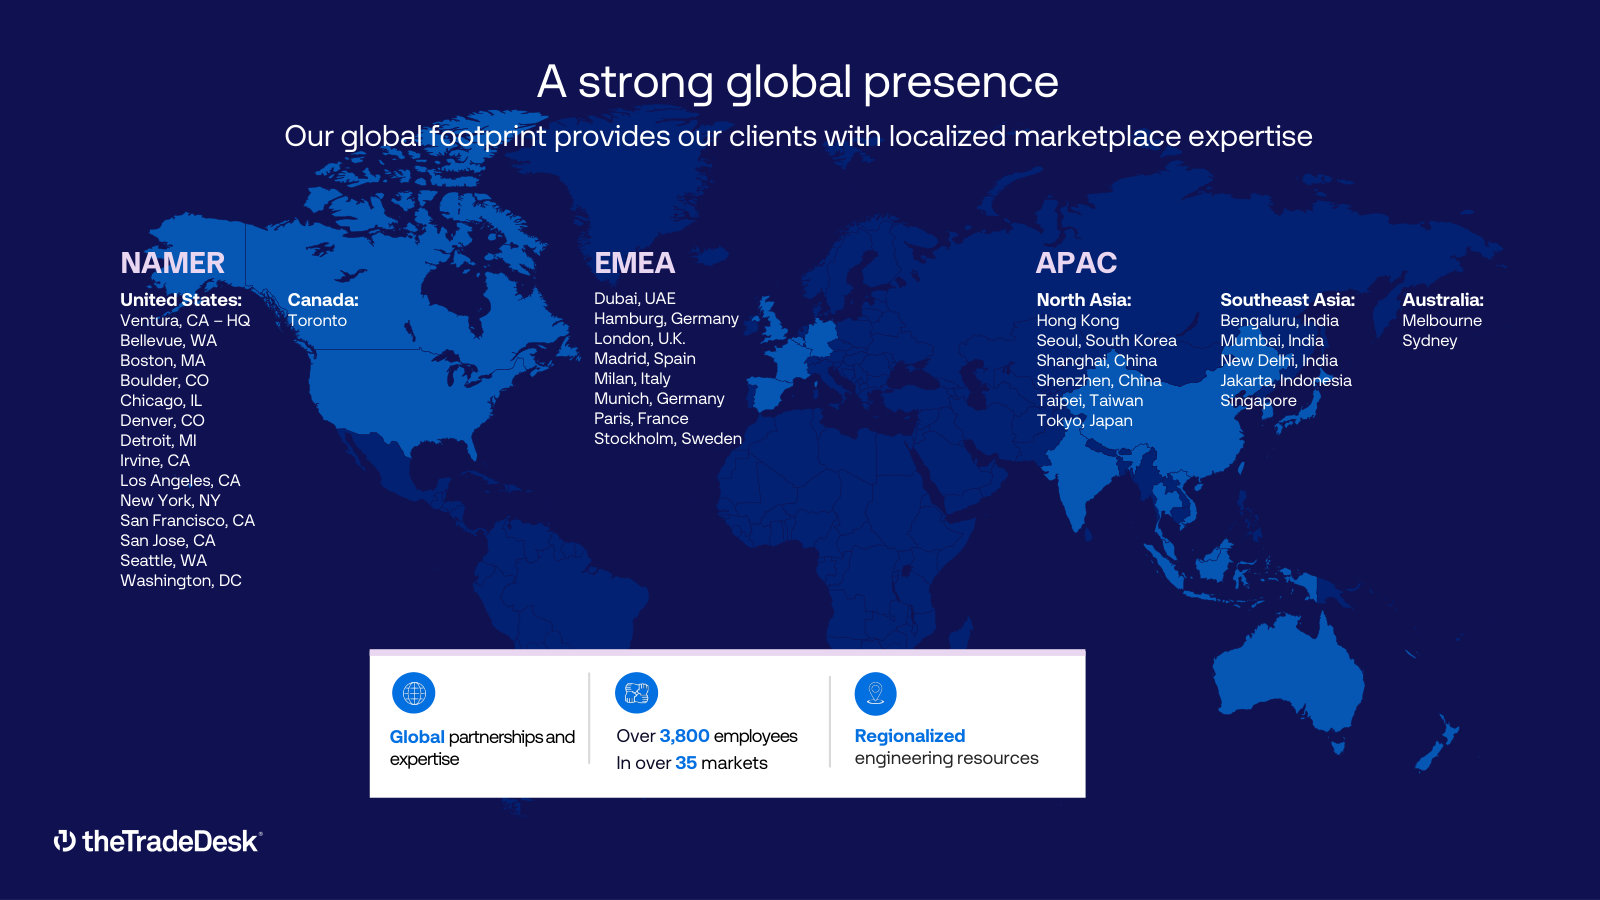
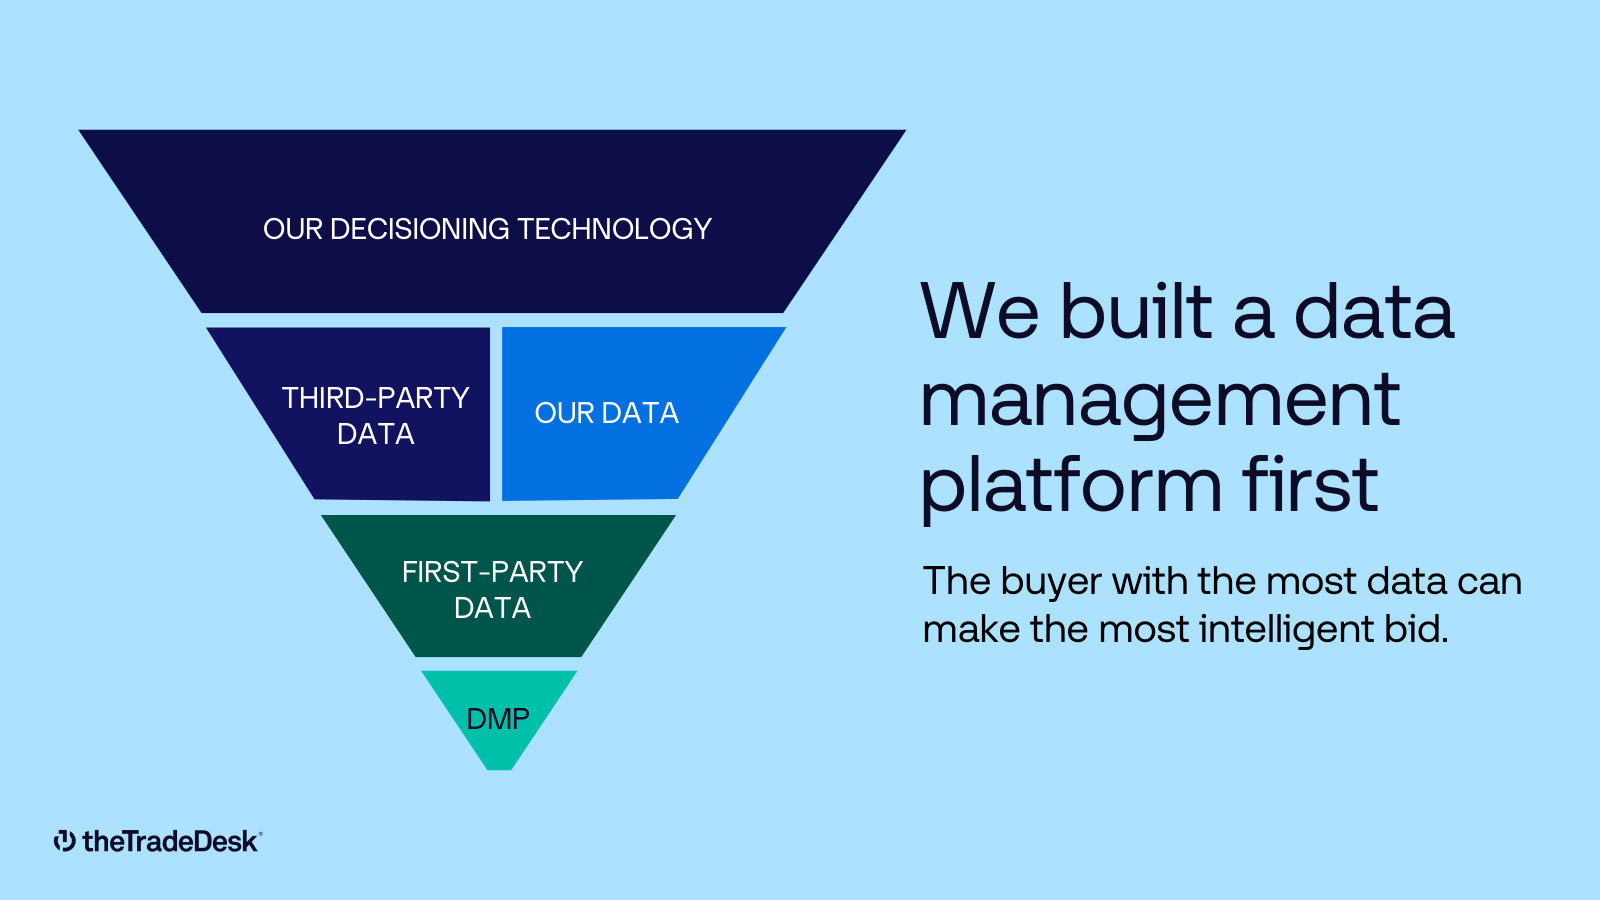
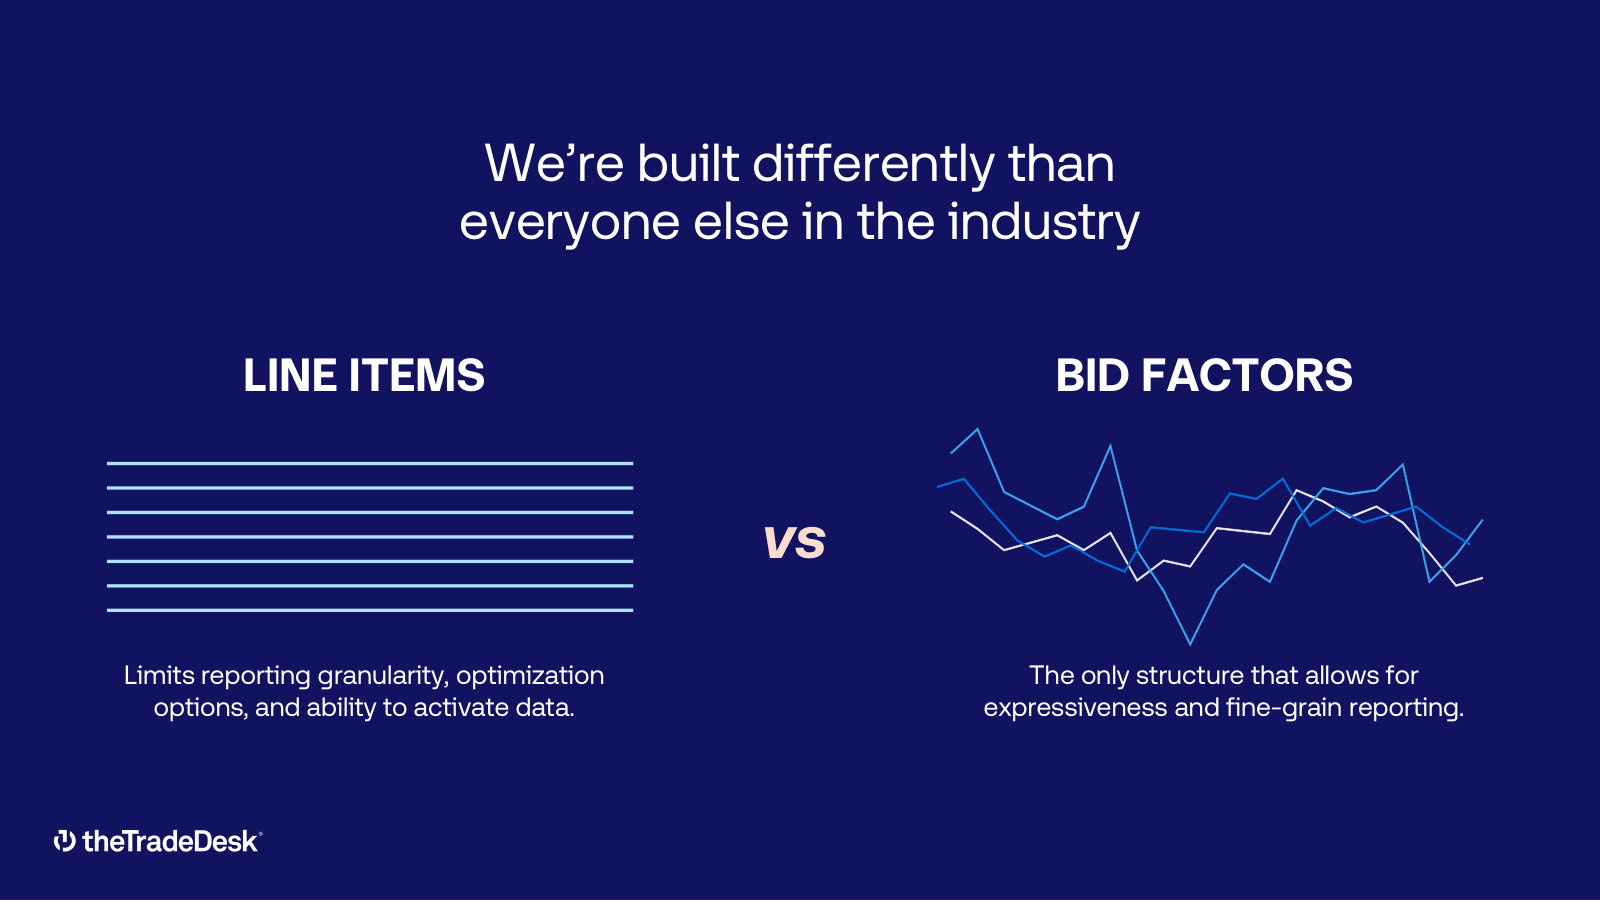
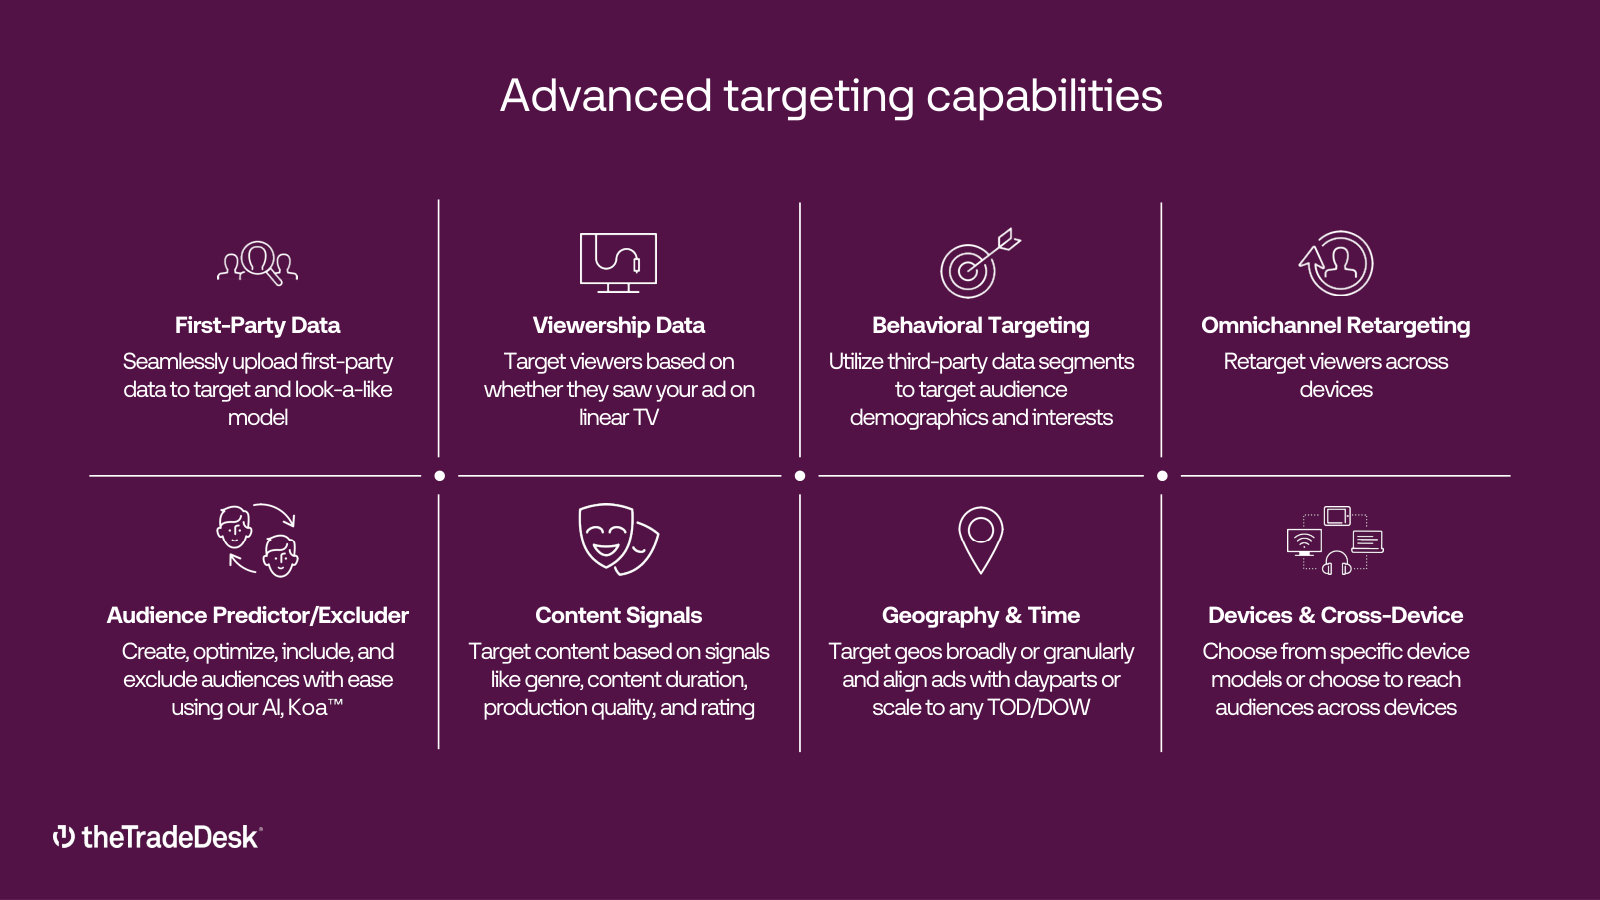
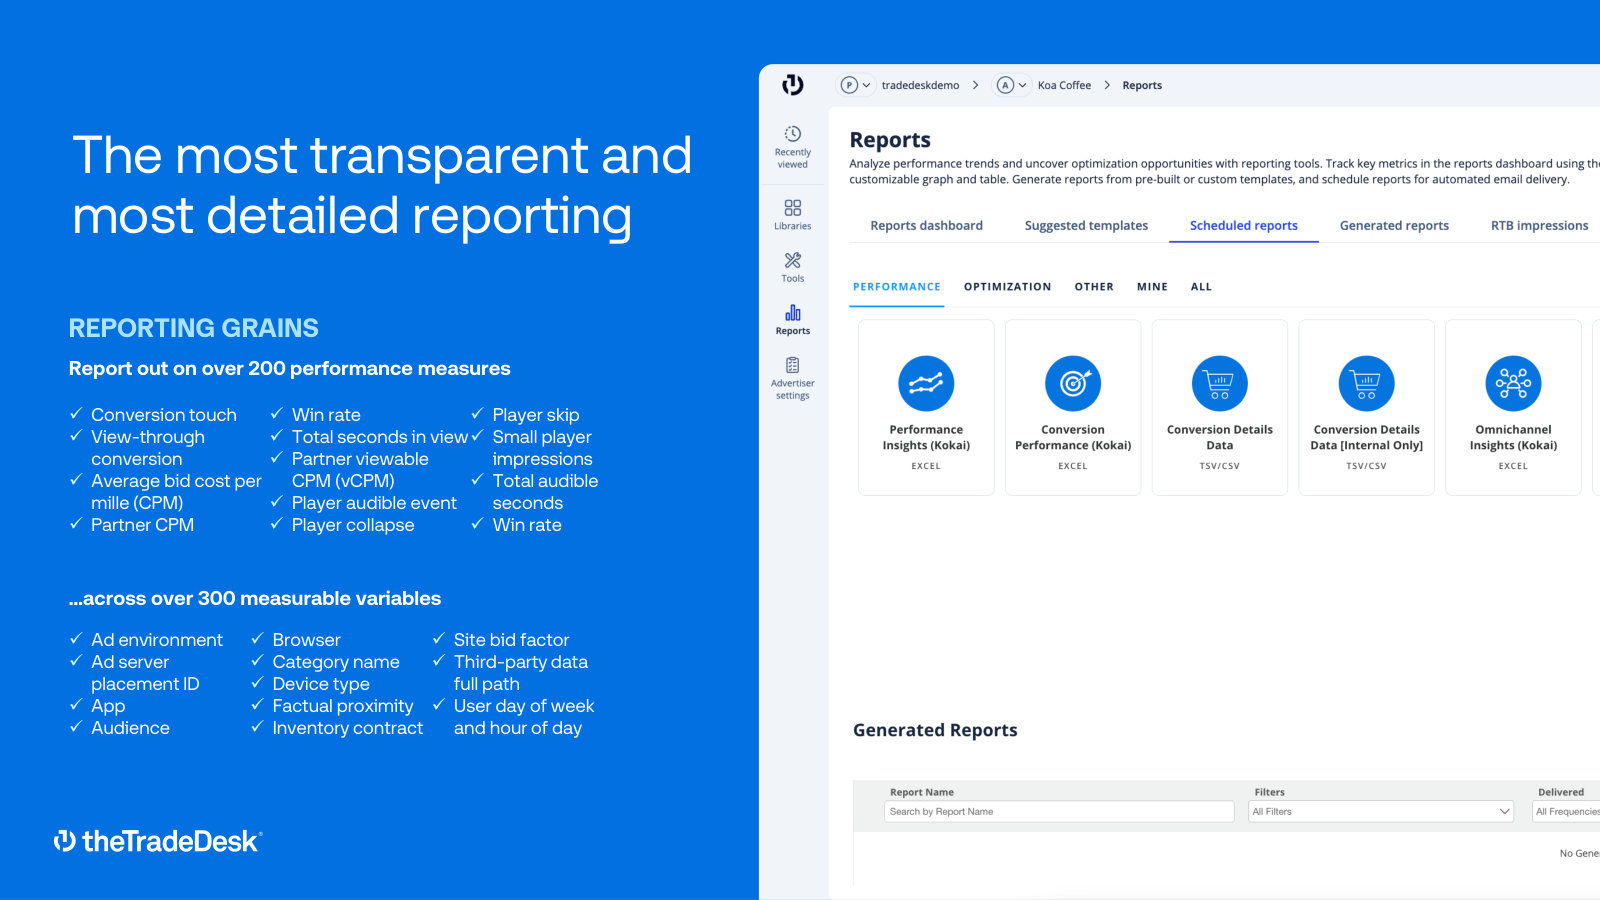
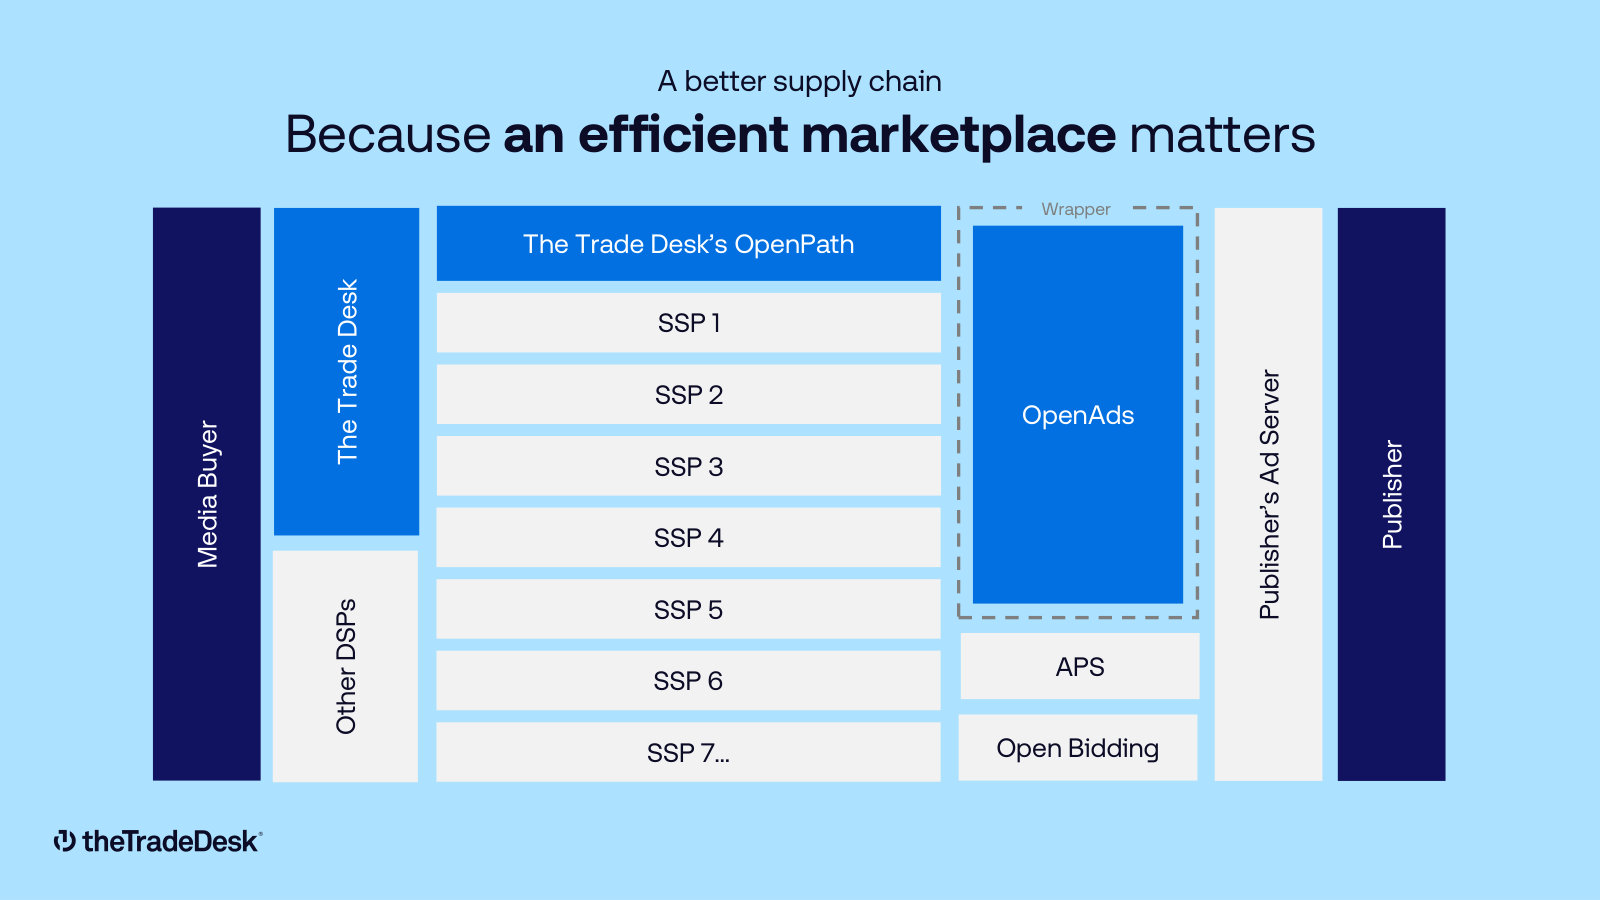
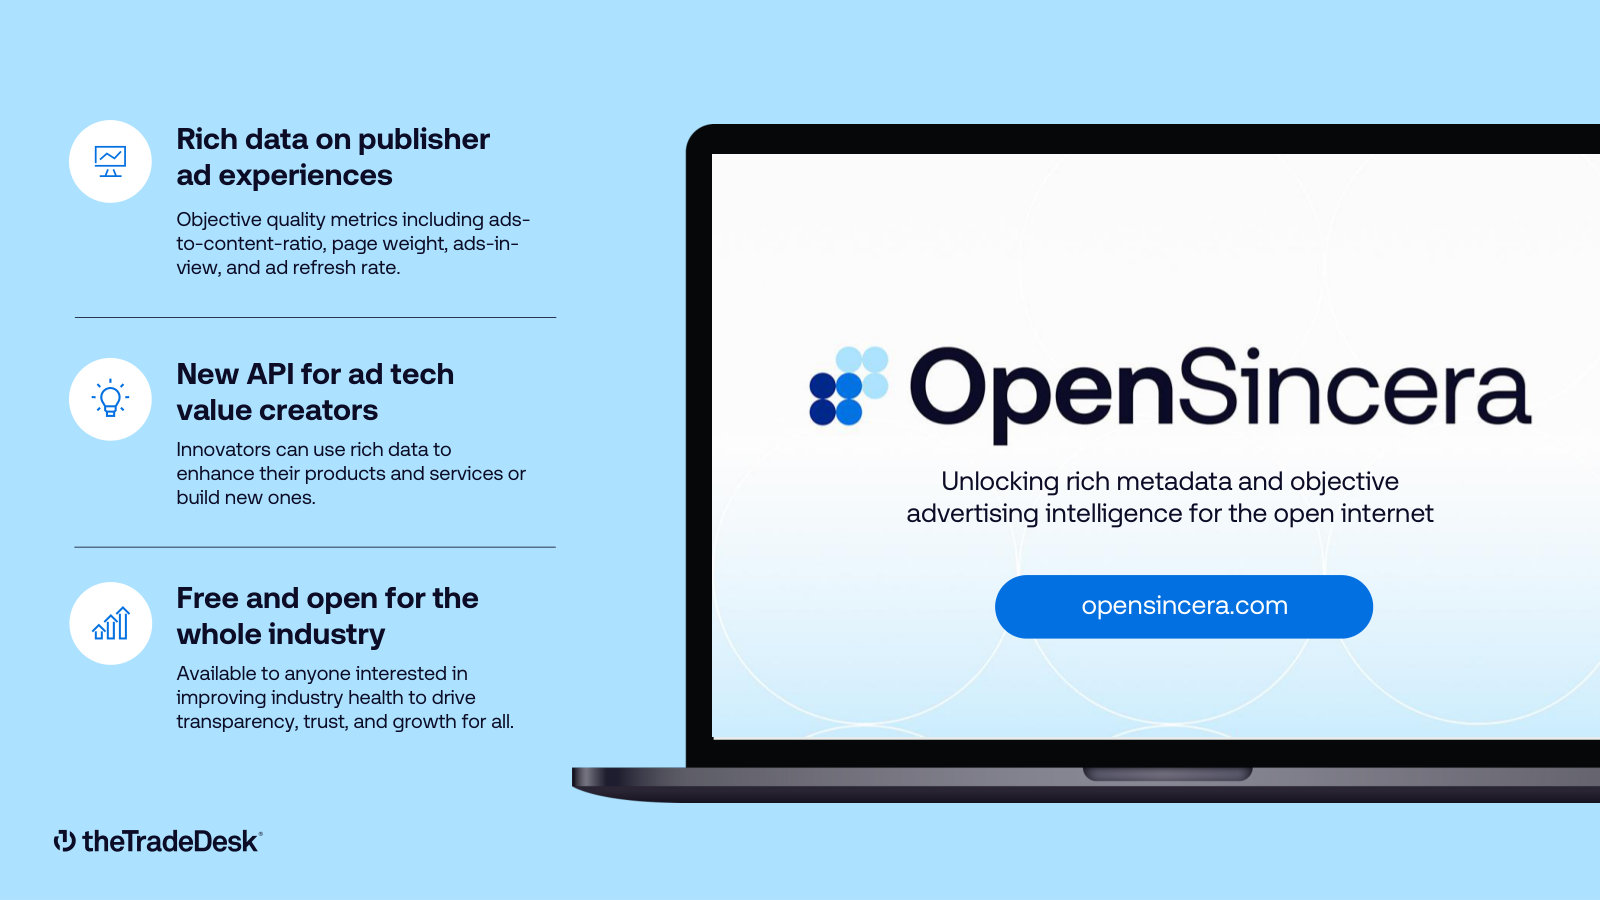
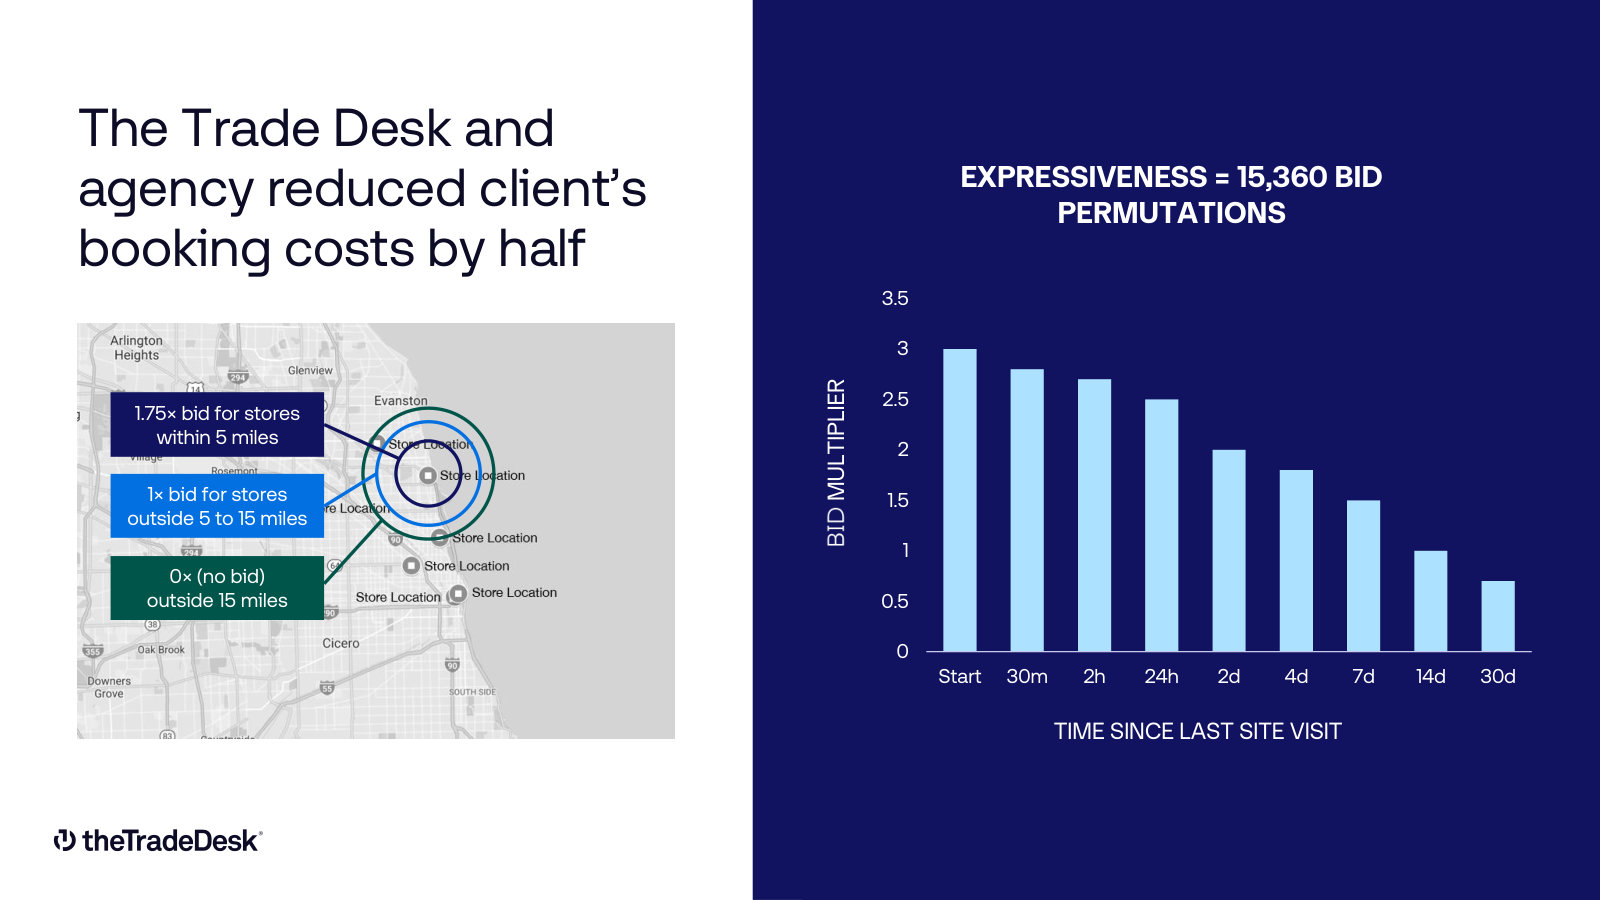
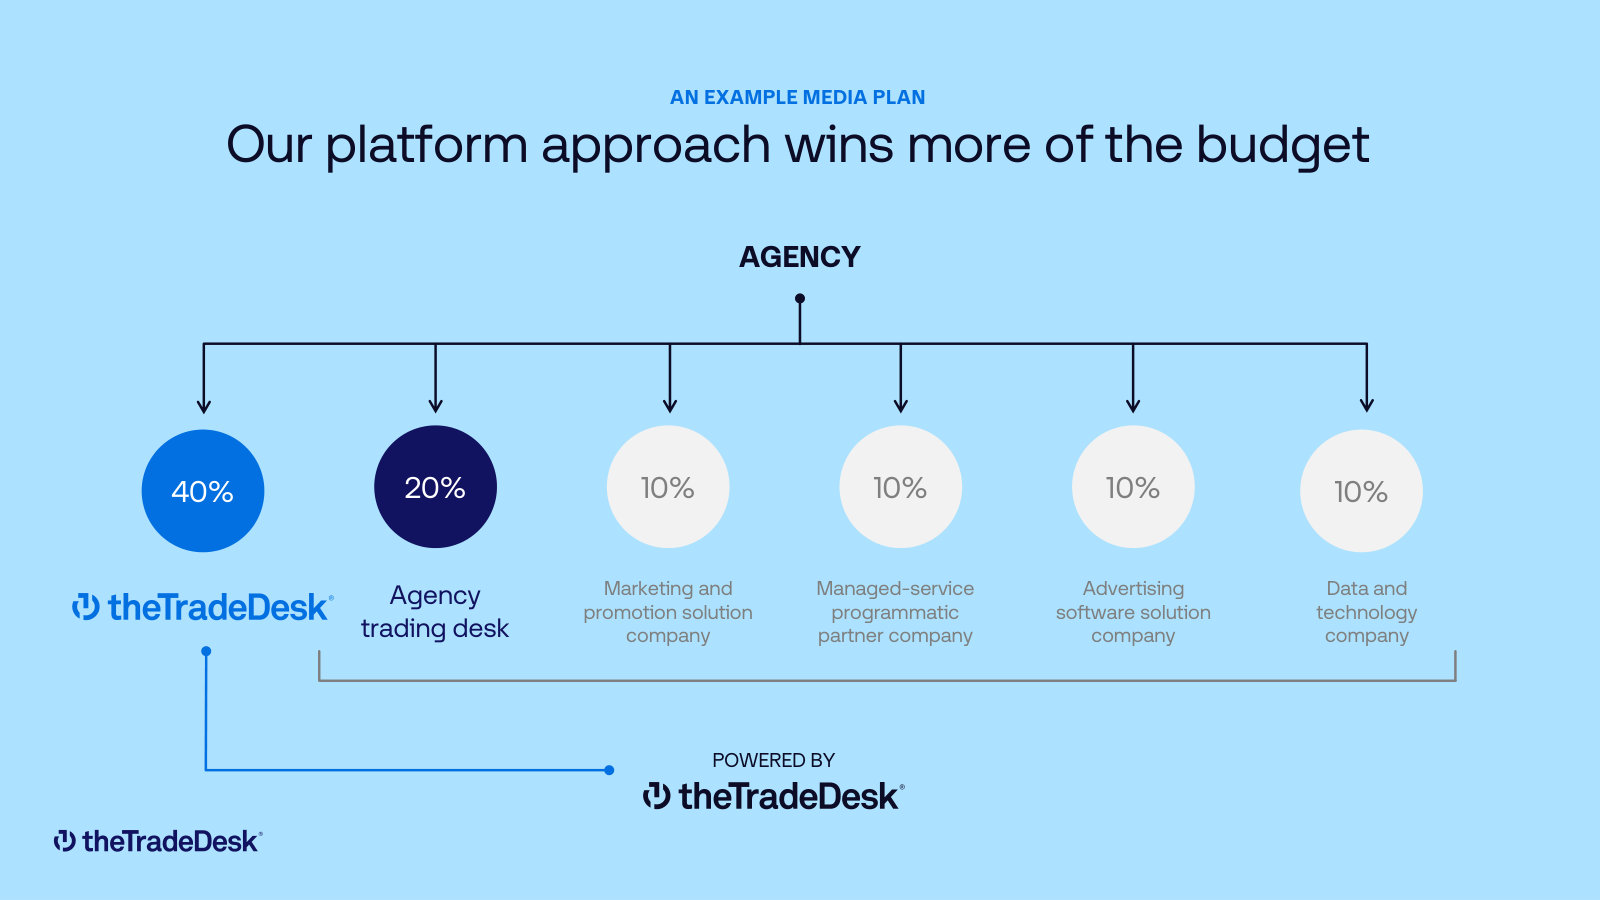
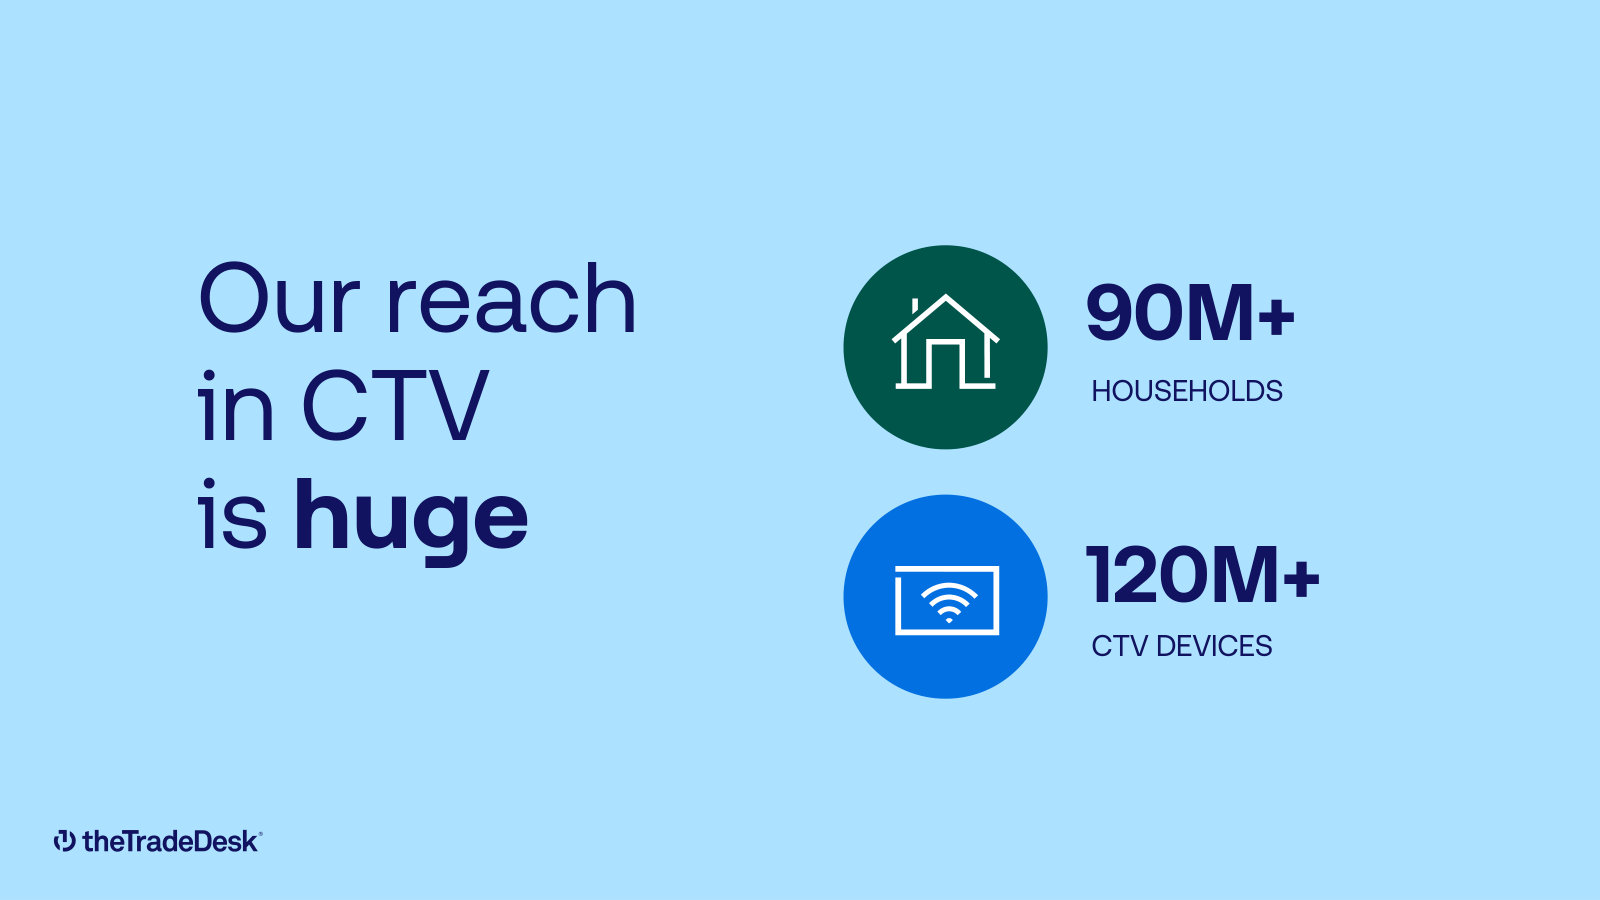
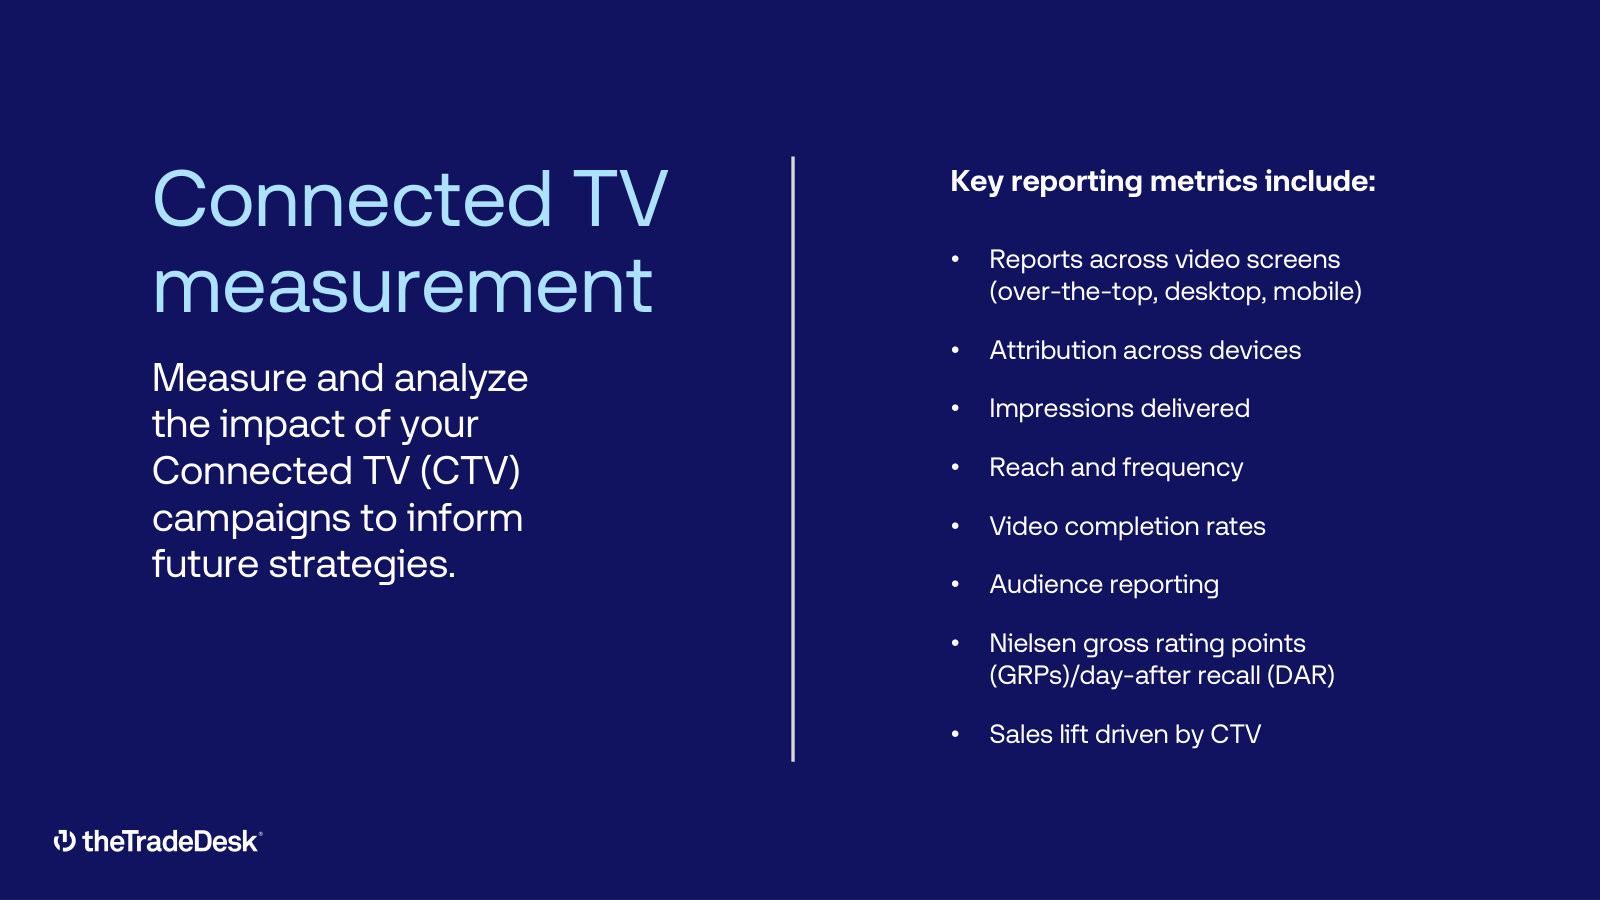
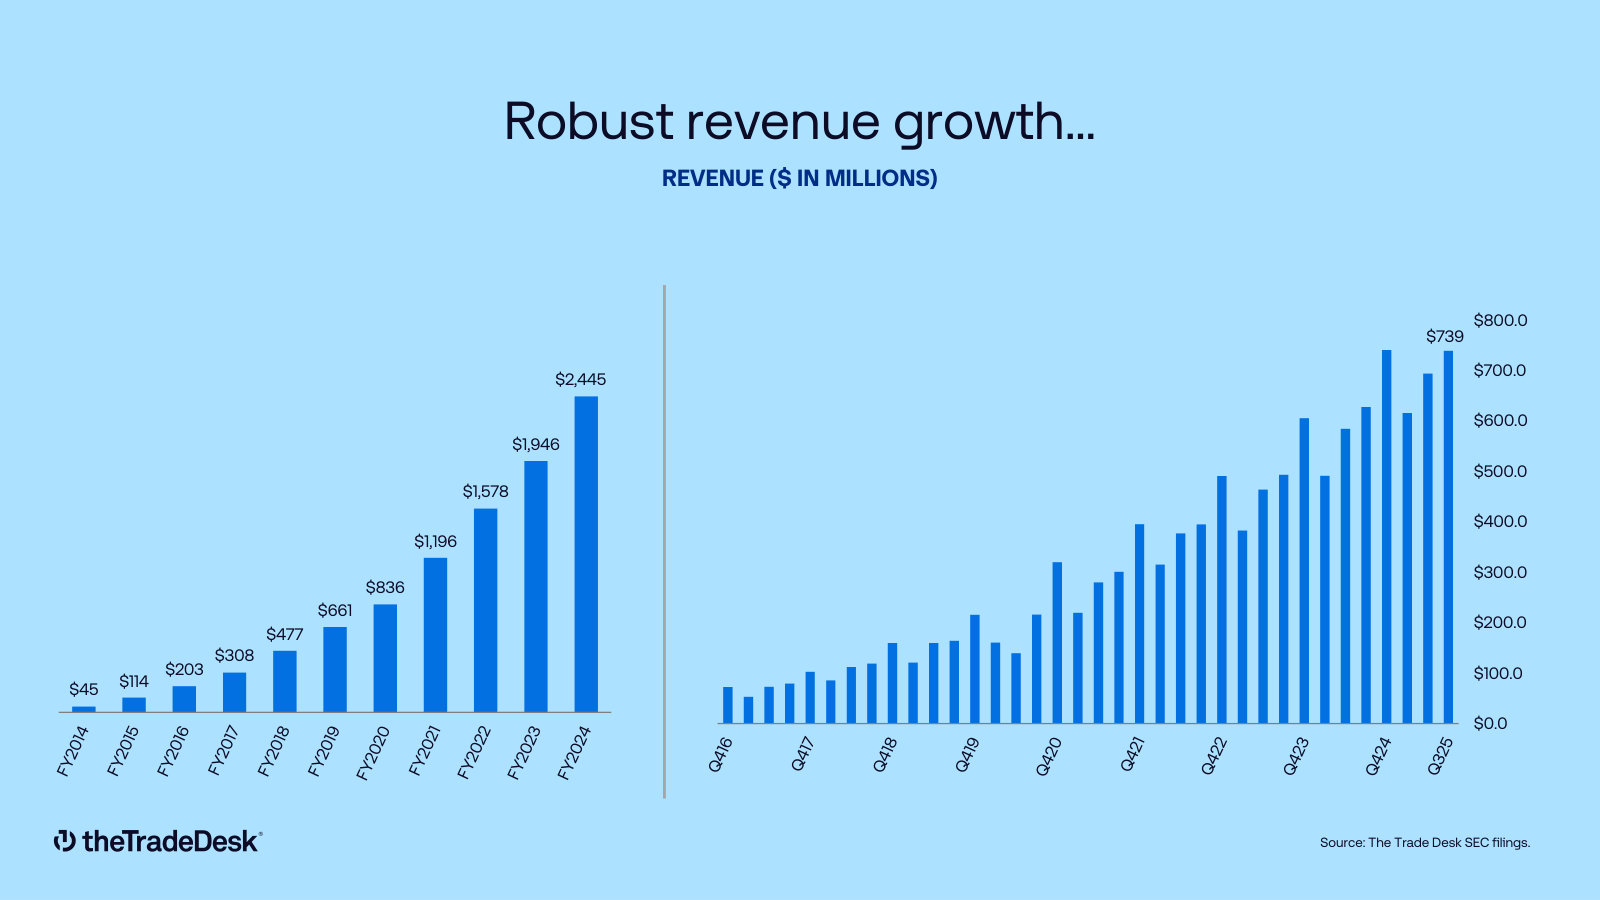
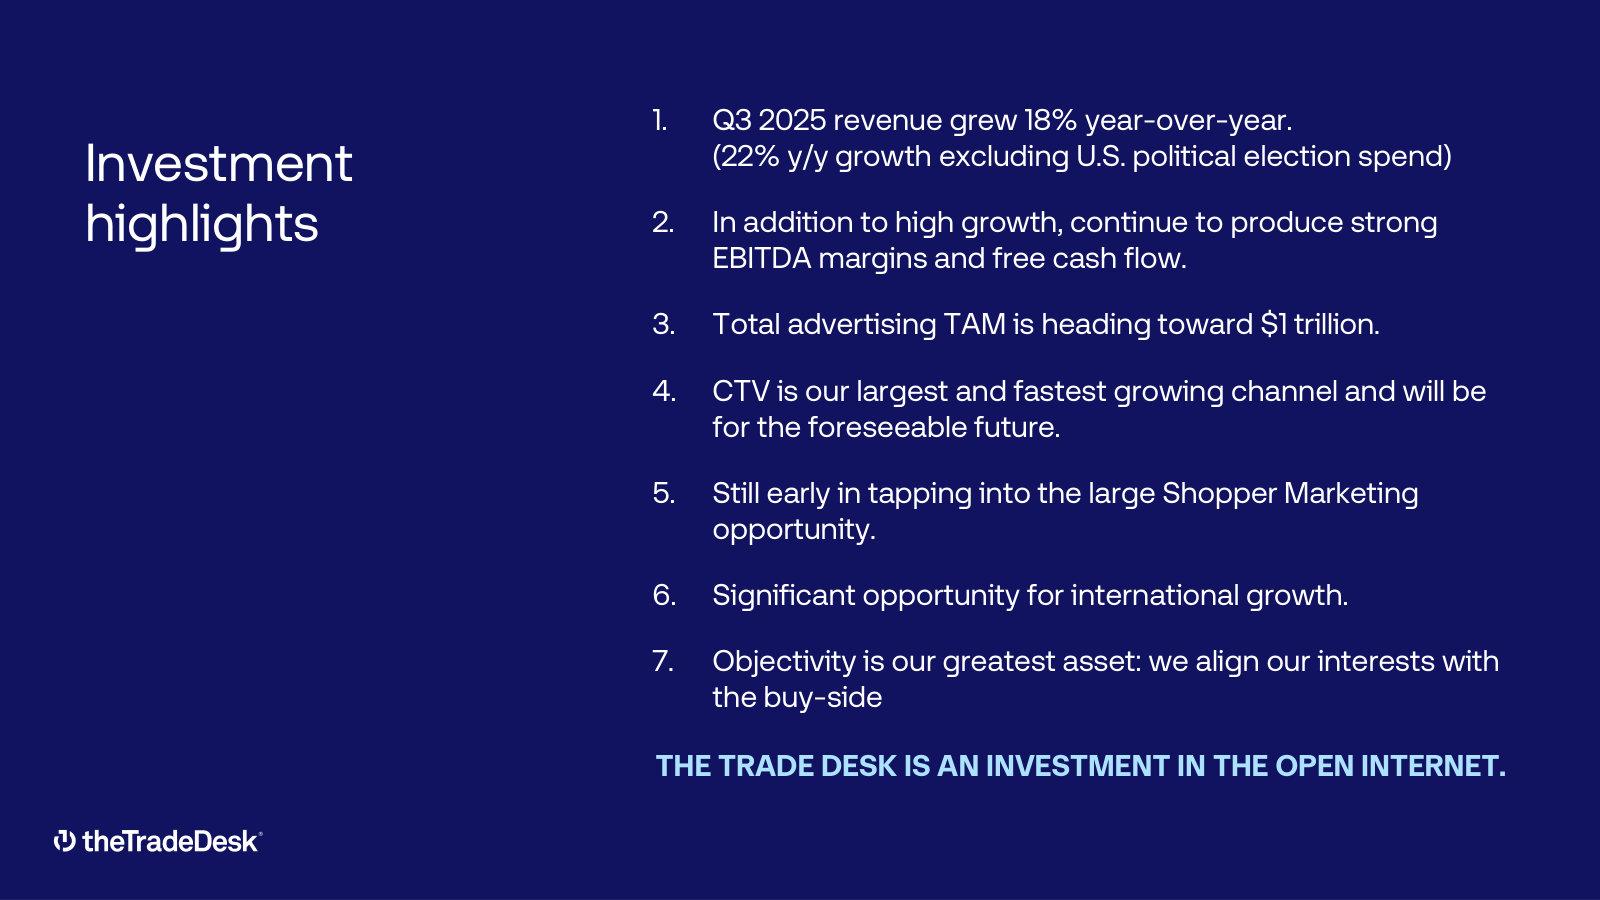
The Trade Desk, Inc.'s management explains the business in its own materials. The slides below do the most of that work, pulled from the documents preserved in Sources. Each source link opens the complete presentation at that slide in a new tab.
Investor Relations Presentation (Q1 2026) — Q1 2026
The current, self-contained overview of what The Trade Desk does, how it makes money, and its main growth drivers — the fastest path from zero to a working understanding. · Open the full document →
Investor Relations Presentation (Q3 2025) — Q3 2025
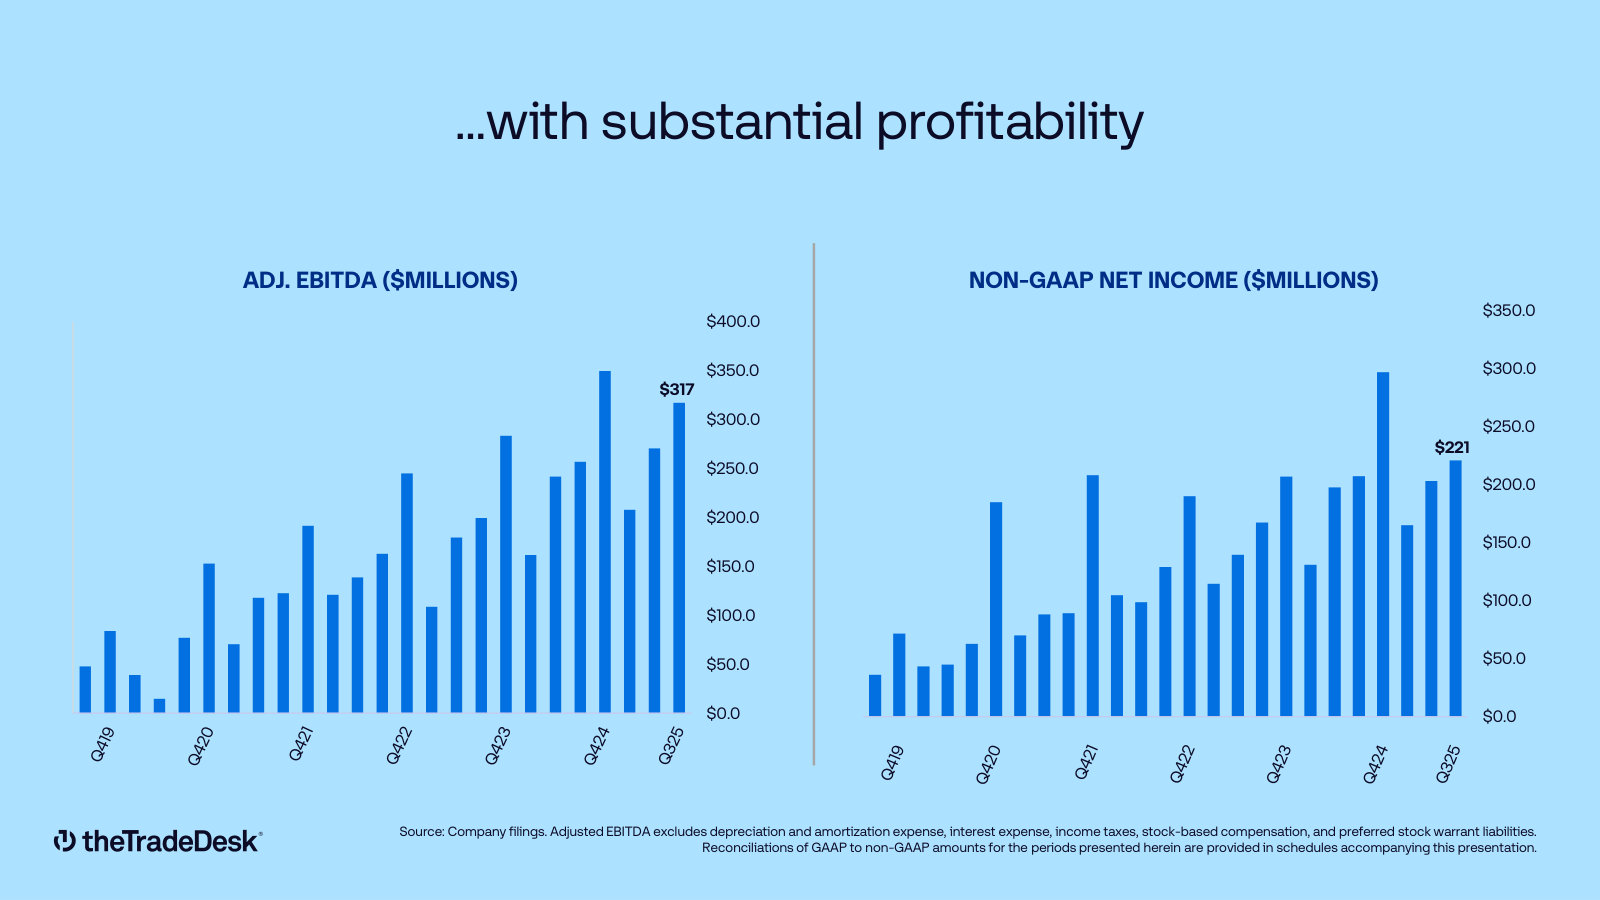
The fuller prior edition — kept for the financial-model charts, the profitability history and the platform-mechanics slides the current deck later trimmed. · Open the full document →
More from management
Investor Relations Presentation (Q4/FY2025) — Q4 2025 · 48 pages · The full-year FY2025 edition — the version that framed the annual results the current deck now updates. · Open →
Investor Relations Presentation (Q4/FY2023) — Q4 2023 · 51 pages · How the market-size framing and CTV story looked two years earlier, before the retail-data and OpenSincera additions. · Open →
Investor Relations Presentation (Q2 2023) — Q2 2023 · 52 pages · The oldest edition in the set — the earlier version of the same pitch, useful for tracking how the equity story evolved. · Open →
The setup
The Trade Desk runs the leading independent platform advertisers use to buy digital ads: profitable, debt-free, converting about 27% of revenue to free cash flow. It is also a stock down roughly 86% from its December 2024 peak after its first guidance miss in eight years, controlled by a founder who still holds nearly half the vote. This chapter sets out what the business is, how it earns, and why a value investor is looking now.
What the company does
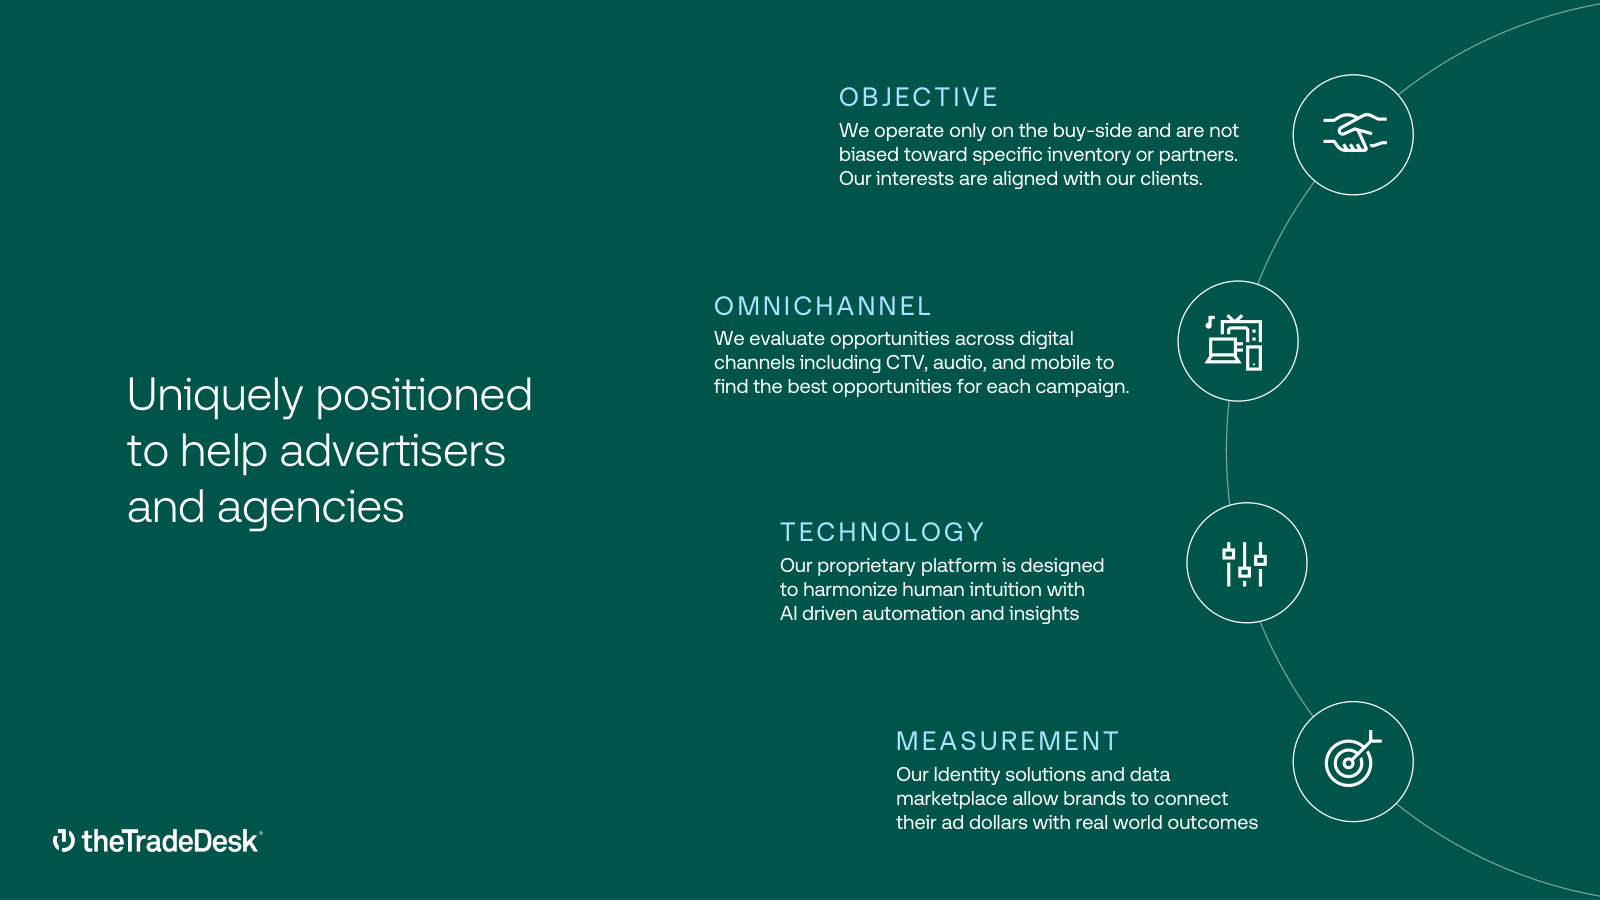
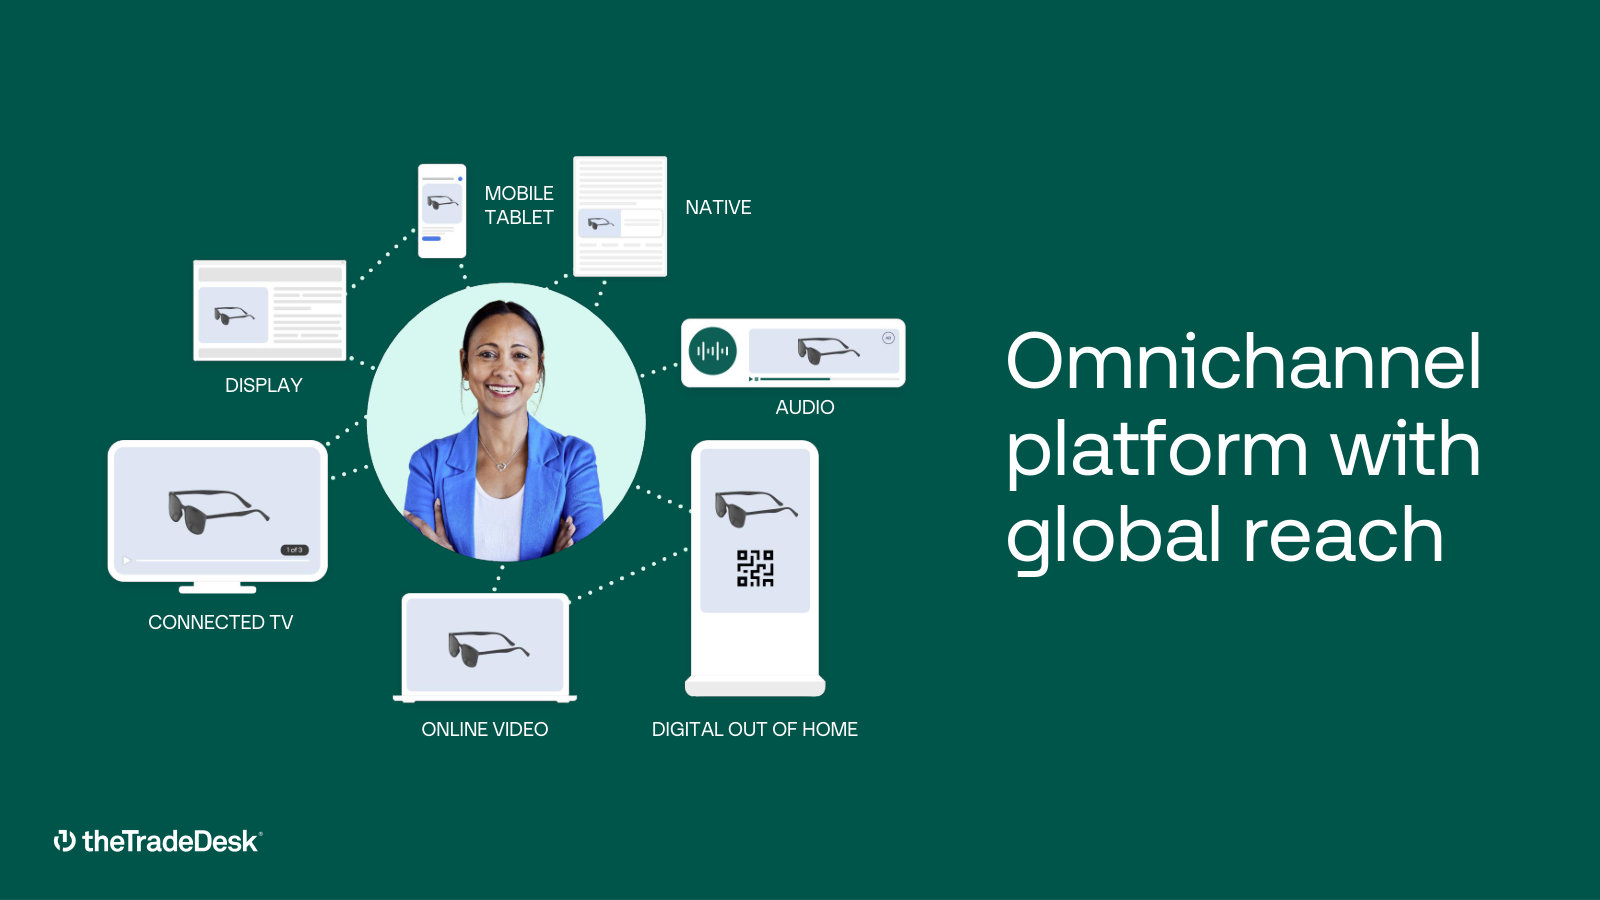
The Trade Desk sells software, not media. Its cloud-based platform lets advertising agencies and large advertisers plan, buy, and measure digital ad campaigns across connected TV (CTV), video, display, audio, and mobile — the "open internet" that sits outside the walled gardens of Google, Meta, and Amazon. In its own words it is "a global leader in advertising technology," operating a self-service platform used by the world's largest agencies and brands [1].
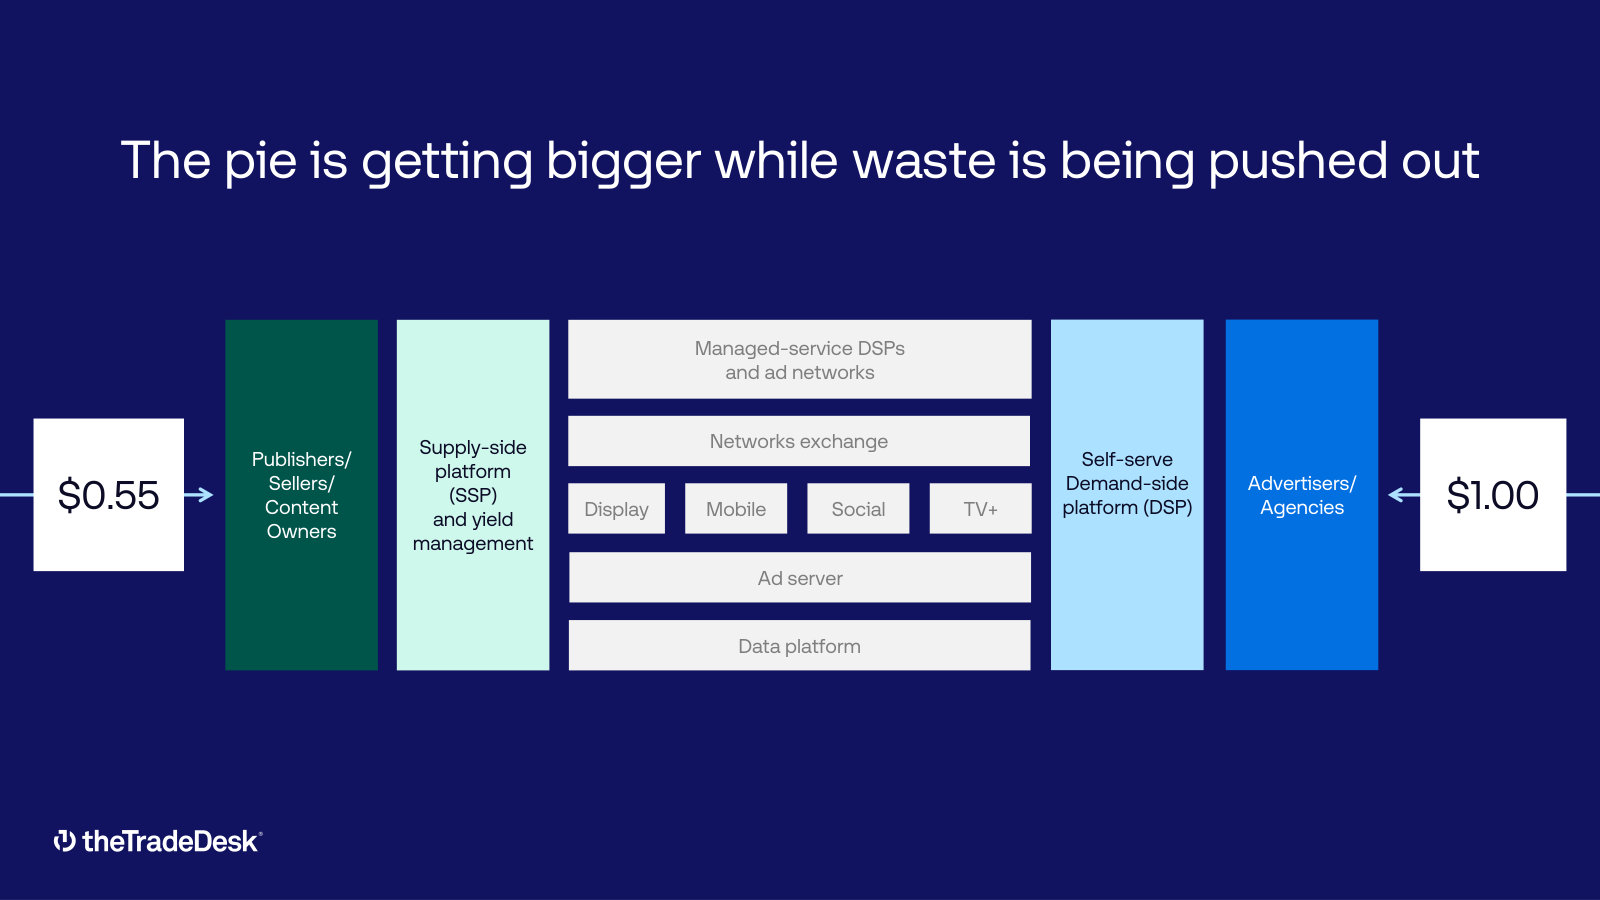
Its defining structural choice is that it works only for the buy side. It does not own advertising inventory or media, which it argues frees it from the conflicts of interest carried by rivals — chiefly Google and Amazon — that both sell ad space and operate platforms to buy it. As supply of ad impressions has outgrown demand, the company frames a buyer's market as playing to its strength: objectivity, it says, "is more valuable in this strengthening buyer's market" [2]. The single largest secular driver behind the business is the shift of television dollars from linear to streaming; the company calls it "a generational shift from linear television to connected television" [3].
How it makes money
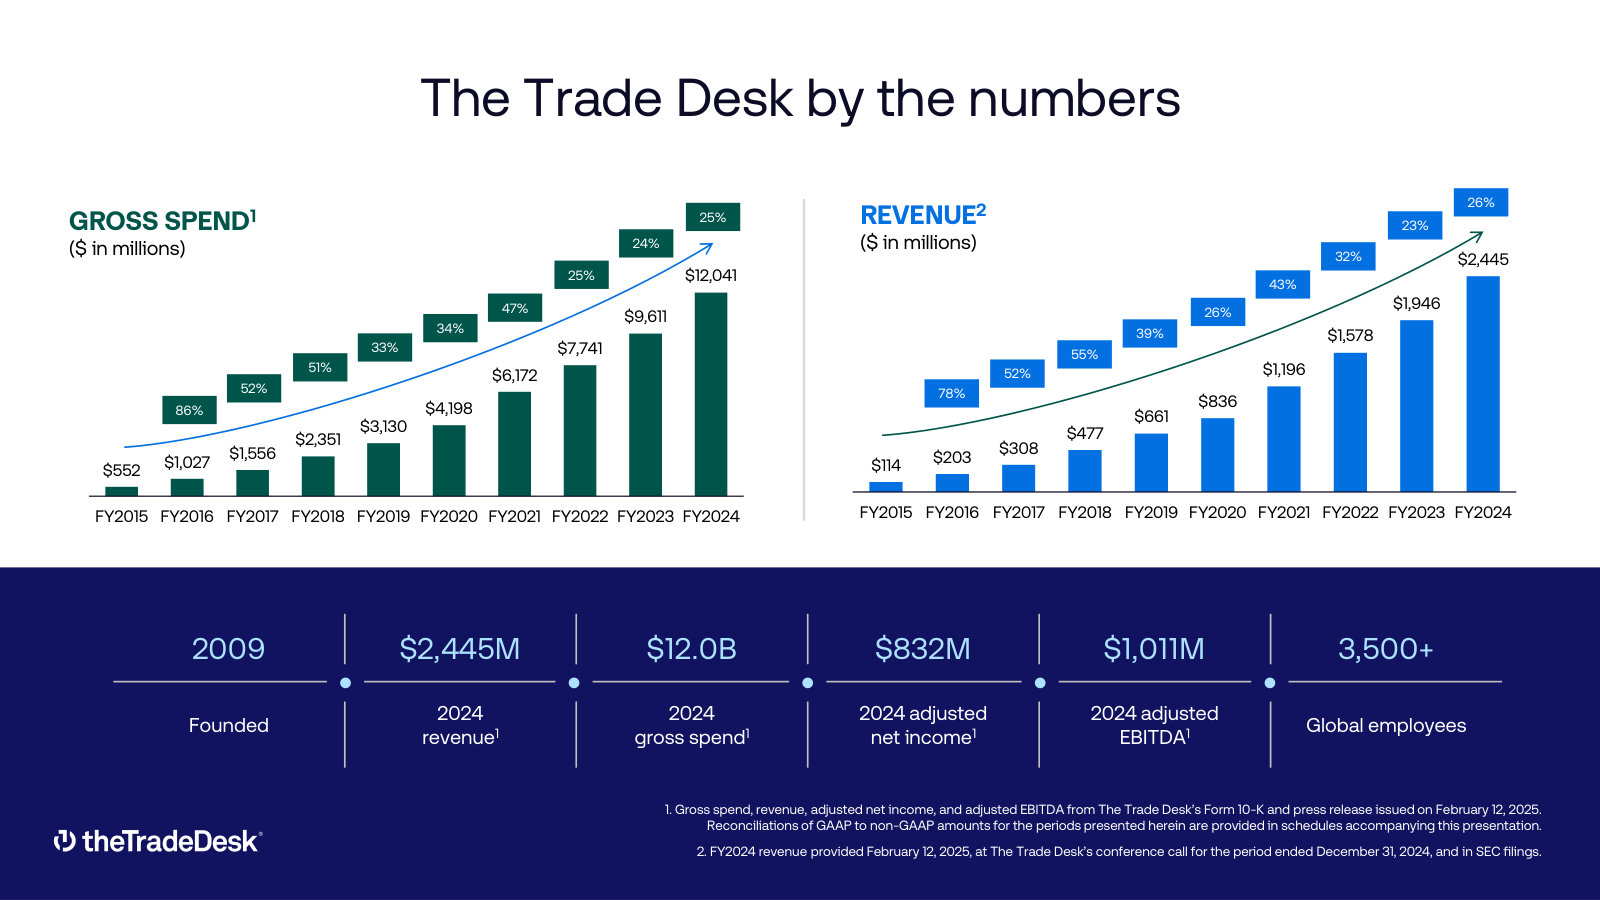
Advertisers route their ad spend through the platform, and The Trade Desk keeps a platform fee — "generally based on a percentage of our clients' total platform spend" [4]. In 2025, roughly $13.4 billion of gross spend flowed across the platform and the company recognized $2.90 billion of revenue from it — an effective take rate of about 21.6%, up from 20.3% a year earlier as clients used more of its data and value-added services [5].
Source: FY2025 Form 10-K, gross spend and revenue [6]. Take rate (revenue ÷ gross spend) rose from 20.3% to 21.6%.
One consequence matters for anyone reading the balance sheet: because clients' full spend — the ad inventory the company buys on their behalf, plus its own fee — passes through its books, receivables ($3.8 billion) and payables ($3.0 billion) dwarf revenue [7]. That is a pass-through of client money, not leverage. It also means the reported revenue line is the company's fee, while the money at risk on the balance sheet is largely its clients'.
A profitable, cash-generative business
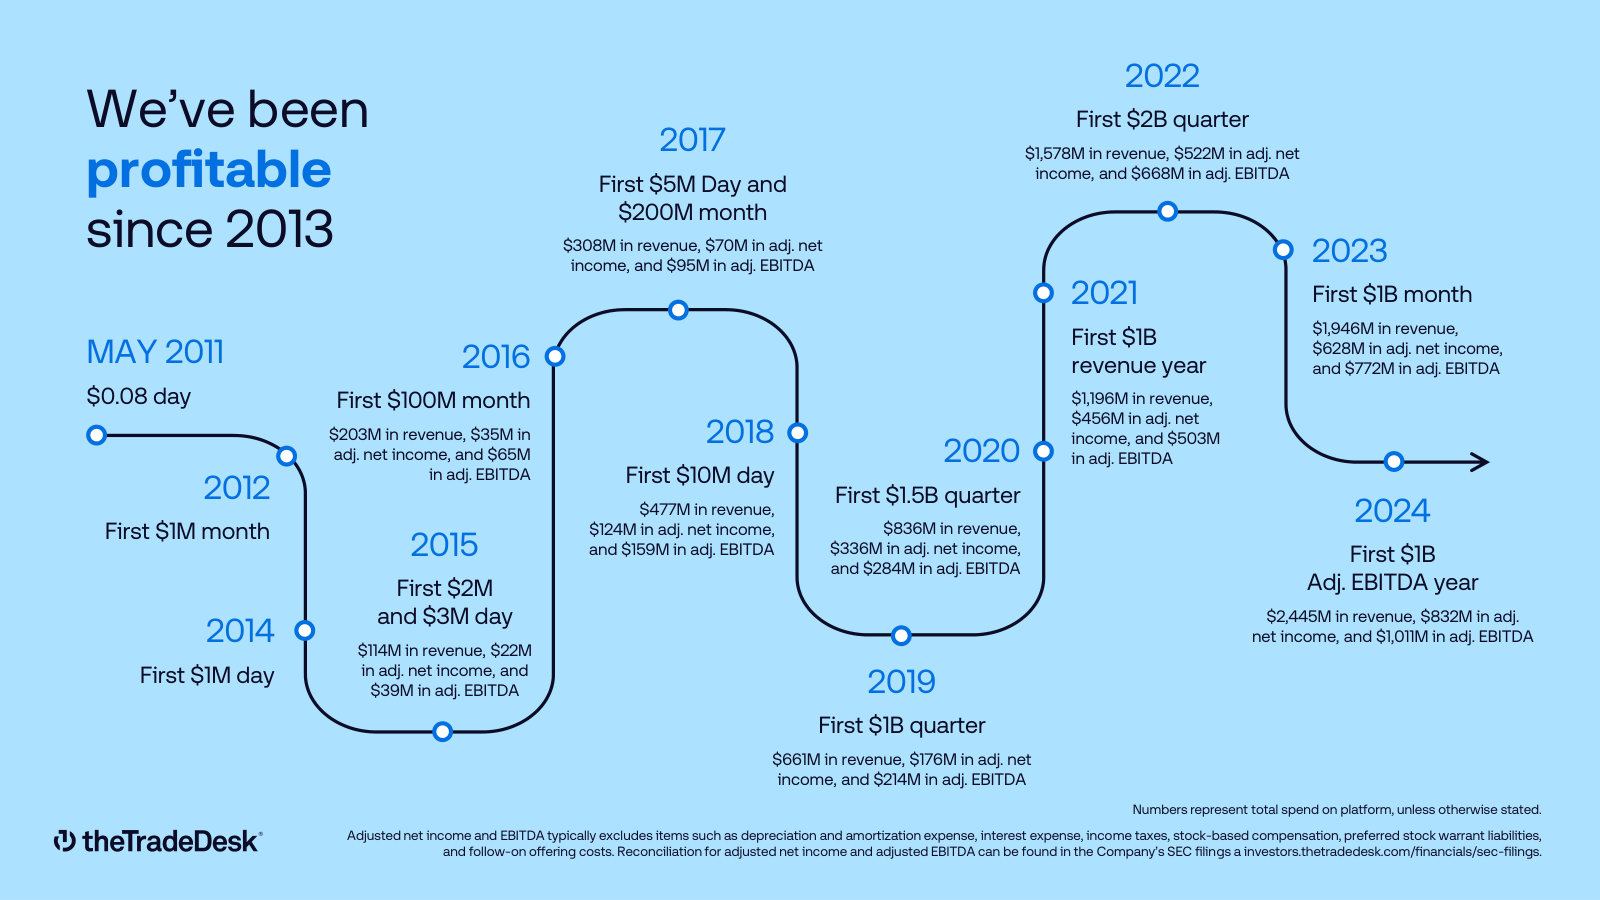
Whatever one concludes about the price, this is not a cash-burning story stock. In 2025 the company earned $443 million of GAAP net income, produced $993 million of operating cash flow, and — after $197 million of capital spending — about $796 million of free cash flow, a 27% free-cash-flow margin. Adjusted EBITDA was $1.2 billion [8].
Revenue FY2025 ($M)
Free Cash Flow ($M)
Net Cash ($M)
Take Rate
Sources: revenue, cash flow and take rate, FY2025 Form 10-K [9] [10]; net cash is cash of $658M plus short-term investments of $645M, with no drawn debt.
The balance sheet answers one of this reader's first questions directly. The company carries no drawn debt and roughly $1.3 billion of cash and short-term investments; interest paid in 2025 was under $1 million [11]. On the question of solvency, the risk of bankruptcy here is remote. The offsetting fact worth carrying forward is that stock-based compensation of $491 million in 2025 slightly exceeded GAAP net income, so the cash-flow strength and the reported-profit strength are not the same number — a thread later chapters should pull.
The fall
The Trade Desk was, for years, one of the most expensive stocks in the market — the kind this investor's rules exclude. That changed. The shares peaked at $139.51 on December 4, 2024 and traded at $19.53 on July 10, 2026, a decline of about 86%. The break was not gradual: it began the day the company reported its December-2024 quarter.
Source: market price history, as reported; year-end closes through 2023, then quarter-end closes, with the December 4, 2024 all-time high shown.
On the fourth-quarter 2024 call, founder and CEO Jeff Green opened by acknowledging that "for the first time in 33 quarters as a public company we fell short of our expectations" — a company that had beaten its own guidance for eight straight years since its IPO — and added plainly, "it was our fault," citing execution and a platform transition [12]. For a company whose valuation had rested on an unbroken record of delivery, the loss of that record — more than the size of the miss — is what reset the stock.
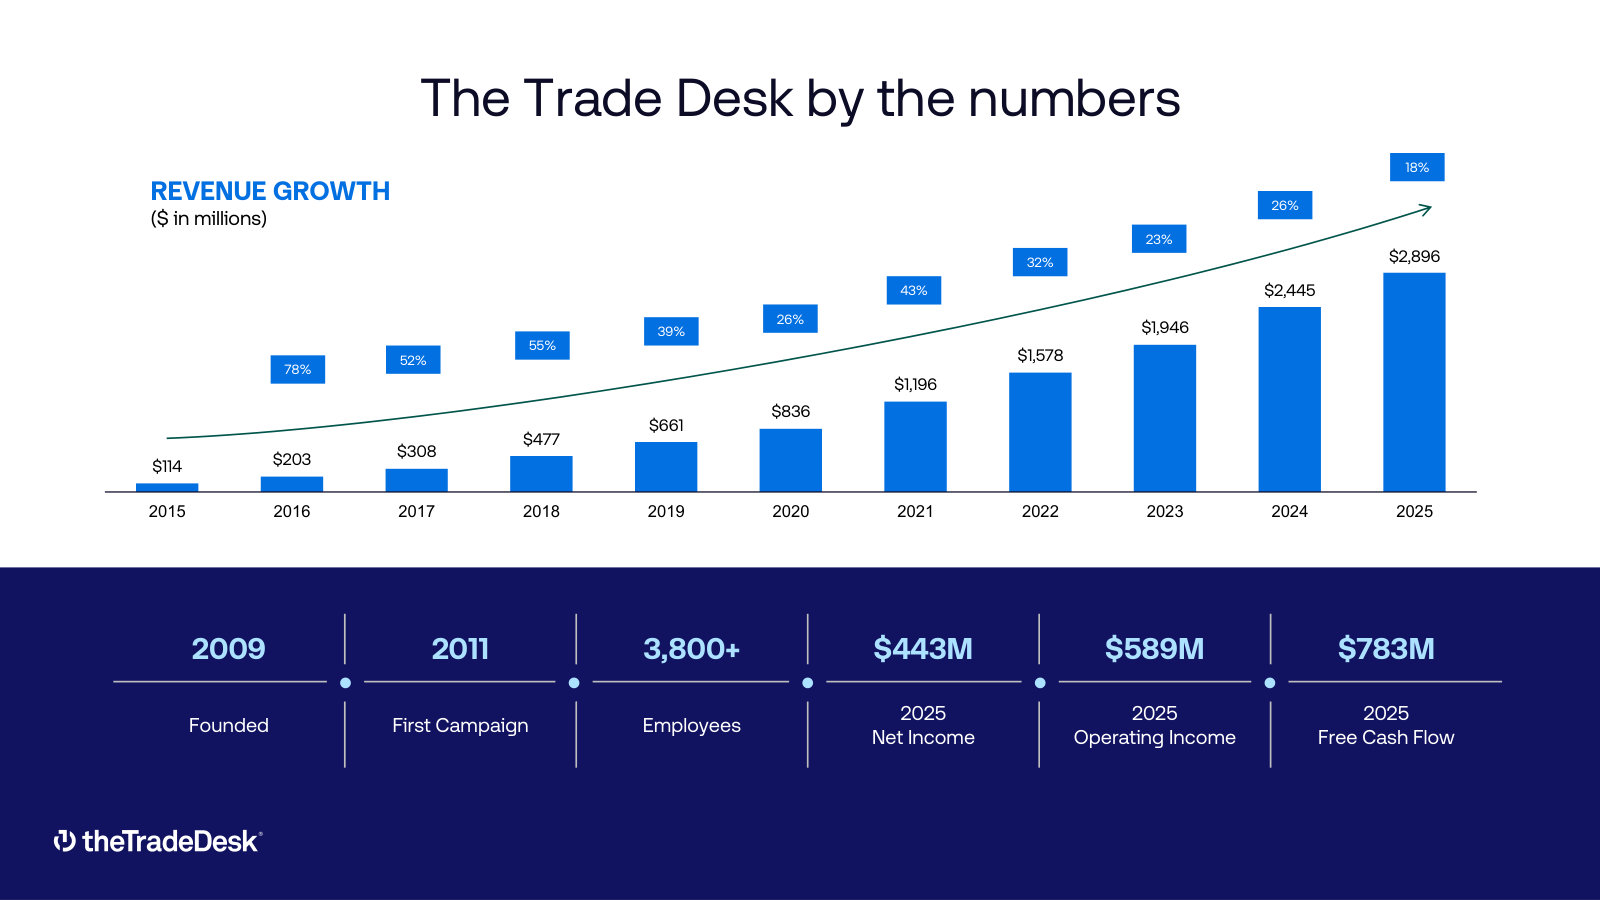
Underneath the price, the growth rate that justified the old multiple has slowed. Revenue grew 26% in 2024 and 18% in 2025 [13]; consensus has 2026 growth near 10%. The company kept growing and stayed profitable through the fall; what changed is the rate of growth, from the mid-20s to near 10%.
Sources: revenue growth FY2022–FY2025 derived from the FY2025 Form 10-K [14]; 2026 is consensus estimate.
A founder still holding the wheel
The Trade Desk is founder-run in the fullest sense. Jeff Green founded the company in 2009, is its CEO and board chairman, and controls it through a dual-class structure: Class B shares carry ten votes each, and he holds 97.6% of them. On roughly 11% of the economics, he commands about 49.7% of the total vote [15]. This is the skin-in-the-game profile a value investor tends to want, with the usual caveat: a controlling founder can act with conviction and can also act without needing anyone's agreement.
His conduct through the decline is at least consistent with alignment. The company repurchased 26.2 million shares for about $1.4 billion during 2025 — buying back stock into the fall — and in February 2026 authorized a further $350 million, leaving about $500 million available [16]. Those buybacks retired 26.2 million shares, while the stock-based compensation that funds the growth adds shares back; whether the repurchases prove well-timed or merely offset that dilution is unresolved here.
What the report tests
Taken together, the setup is specific. A debt-free, founder-controlled, cash-generative leader of a real secular shift — CTV and the open internet — has fallen about 86% and now trades at roughly 22 times trailing GAAP earnings, near 12 times free cash flow, and about 10 times free cash flow on an enterprise basis after netting out cash. At its 2024 peak it fetched roughly 180 times earnings.
Market Cap ($M)
Enterprise Value ($M)
Price / Free Cash Flow
Forward P/E (adj.)
Source: derived from the $19.53 close on July 10, 2026 and 478 million shares outstanding per the 2026 proxy [17]; free cash flow per the FY2025 Form 10-K [18]; forward P/E on FY2026 consensus adjusted EPS of about $1.85.
That framing sets the through-line this report will test: whether The Trade Desk's roughly 86% fall has turned a former high-flyer into a genuinely mispriced business — a founder-controlled, debt-free, cash-generative leader now near ten times free cash flow — or whether the compression only reflects a growth story that is still slowing and still not cheap enough for the margin of safety a value investor demands.
The pieces that decide it are laid out but not yet weighed: the three-year financial record and the forward estimates behind that ~10% growth; how durable the take rate and the CTV tailwind really are against Amazon and the walled gardens; what the buybacks and stock-based compensation net to; and how much pessimism is already in a stock that most of Wall Street now rates a hold. Those are the chapters that follow.
The three-year record and what the Street now expects
The Trade Desk's last three fiscal years show a business that kept compounding revenue and expanding its GAAP margins while turning more than a quarter of sales into free cash flow, carrying $1.3 billion of net cash and no drawn debt. Two facts complicate the picture: revenue growth has roughly halved toward 10%, and stock-based compensation of about $490 million a year runs above GAAP net income — so the adjusted profits the market pays roughly ten times for are close to double the statutory figure.
This tab lays out the reported numbers a cold reader needs before any judgment on price: the income statement, cash generation, the balance sheet, the wedge between GAAP and "adjusted," and the forward consensus.
Revenue: still growing, growing more slowly
Revenue rose from $1.95 billion in FY2023 to $2.90 billion in FY2025 [1]. The rate, not the level, is what changed: a 26% gain in FY2024 gave way to 18% in FY2025, and consensus now models roughly 10% for FY2026 and FY2027.
Source: FY2023–FY2025 reported per FY2025 Annual Report, Consolidated Statements of Operations [2]; FY2021–FY2022 per company filings; FY2026–FY2027 consensus estimates.
Source: derived from reported revenue, FY2025 Annual Report [3]; FY2026–FY2027 consensus estimates.
The deceleration is not linear — FY2024 accelerated on FY2023 before FY2025 rolled over — which matters for how a reader reads the forward number. The company reports as a single operating segment, the advertising-technology platform; beyond a United States/International split it discloses no revenue breakdown by channel or vertical in the financial statements [4], so the growth line above is the cleanest lens the filings give.
Margins: real GAAP operating leverage
Below revenue, the three years show genuine operating leverage. GAAP operating margin roughly doubled, from 10.3% in FY2023 to 20.3% in FY2025, as revenue outgrew operating expenses [5]. General and administrative expense actually fell in FY2025, to $518 million from $536 million, partly because the stock-based expense tied to the CEO Performance Option is winding down [6].
Source: operating and net margin from Consolidated Statements of Operations [7]; FCF margin derived from Consolidated Statements of Cash Flows [8].
Net margin dipped slightly in FY2025, to 15.3% from 16.1%, because the tax rate rose — the provision for income taxes jumped to $215 million from $114 million even as pre-tax income grew [9]. The operating line, not the bottom line, is where the leverage shows.
Cash and the balance sheet: the bankruptcy question
For a reader who wants the chance of bankruptcy near zero, the balance sheet answers plainly. At the end of FY2025, The Trade Desk held $658 million of cash and $645 million of short-term investments — about $1.3 billion of gross liquidity — against no drawn debt [10]. Free cash flow reached $796 million, or 1.8 times GAAP net income [11].
Net Cash (FY2025)
Free Cash Flow (FY2025)
FCF / Net Income
Drawn Debt
Source: cash and investments from Consolidated Balance Sheets [12]; free cash flow derived from Consolidated Statements of Cash Flows [13].
Two features of the cash statement deserve a reader's eye. First, net cash fell over FY2025, from about $1.9 billion to $1.3 billion, because the company repurchased $1.38 billion of stock — well above the year's free cash flow — and drew the balance down to fund it [14]. Second, capital spending is rising fast: purchases of property and equipment reached $197 million in FY2025, up from $98 million in FY2024 and $47 million in FY2023, as the company builds out infrastructure for its platform [15]. Free cash flow has still grown each year, but capex is now a real and growing claim on operating cash.
Source: Consolidated Statements of Cash Flows, FY2025 Annual Report [16].
The large accounts-receivable balance on the balance sheet — $3.8 billion, larger than a full year of revenue [17] — is not a collection problem but the gross advertising spend the company invoices on behalf of clients and largely pays through to media owners; it grew alongside a $3.0 billion payable. The economics of that pass-through, and the quality of the cash it throws off, are their own subject and belong to a later chapter.
The GAAP-versus-adjusted wedge
The feature to hold in mind about these earnings is that stock-based compensation is large, roughly flat, and excluded from every "adjusted" figure the market quotes. In FY2025 the company recorded $491 million of stock-based compensation — 17% of revenue and about 111% of GAAP net income [18]. Adjusted EBITDA of $1.20 billion, the company's headline profitability measure, is reached by adding that $491 million back to net income, along with depreciation, tax and net interest income [19].
Source: net income and stock-based compensation from Consolidated Statements of Cash Flows [20]; Adjusted EBITDA from Non-GAAP reconciliation [21].
There is a fairer reading on the other side. Stock-based compensation as a share of revenue is falling — 25% in FY2023, 20% in FY2024, 17% in FY2025 — so the drag is shrinking as the business scales [22], and the company has been repurchasing stock partly to contain the dilution it creates. The point is not that adjusted numbers are illegitimate; it is that a value investor sizing a margin of safety should know the "earnings" in a forward price-to-earnings multiple are the adjusted ones. On GAAP, FY2025 diluted earnings were $0.90 a share; the adjusted basis consensus uses was roughly twice that.
Source: Consolidated Statements of Operations [23], Cash Flows [24], and Non-GAAP reconciliation [25], FY2025 Annual Report. Diluted EPS is GAAP; FY2023 Adjusted EBITDA not disclosed in this filing.
What the Street expects — and is still cutting
Consensus models revenue of about $3.18 billion in FY2026 and $3.48 billion in FY2027, each roughly 10% growth, with adjusted earnings per share of about $1.85 and $2.15. Against the current $19.53 share price, that is roughly 11 times FY2026 and 9 times FY2027 adjusted earnings — cheap-looking, but on the adjusted basis that adds back stock compensation, and on a base that keeps being marked down.
Source: FY2025 revenue reported [26]; FY2026–FY2027 revenue and adjusted EPS, and FY2025 adjusted EPS, per consensus estimates.
The revision trend cuts against the cheap-multiple read. The FY2026 adjusted EPS estimate has been cut from about $2.07 ninety days ago to $1.85 today, and in the last 30 days downward EPS revisions outnumbered upward ones by roughly 18-to-1 across the near-term quarters and years. This is not a stabilised forecast; it is one the sell side is still lowering.
Source: consensus estimate revisions, as reported by the estimate aggregator.
Sentiment on the stock is now cautious rather than bearish. Of 36 analysts, 13 rate it buy or strong buy, 19 hold, and 4 sell or strong sell; the mean price target is $24.42 and the median $24.50, against the $19.53 price — an implied upside of roughly 25%, with a range from $11 to $38 that captures how unsettled the view is.
Current Price
Mean Target
Low Target
High Target
Source: analyst price targets and recommendations, consensus data as of July 2026.
The reported record is a profitable, cash-rich, debt-free business priced near ten times adjusted free cash flow, on earnings that lean on an add-back and a growth rate still being cut toward 10%. Whether that is margin of safety or a value trap is most sensitive to the moat and the durability of the growth, which the chapters that follow take up.
Independence Moat
The Trade Desk's competitive position rests on one structural fact: it is the largest independent buy-side platform in an industry where its biggest rivals — Google and Amazon — also own the media they sell, a conflict TTD does not carry. That independence has produced an eleven-year run of 95%-plus client retention [1]. But the open internet it serves is growing more slowly than the walled gardens, and the moat is being tested at its edges. Whether it holds decides whether the decelerating base is a floor or the start of a slide.
The market it plays in
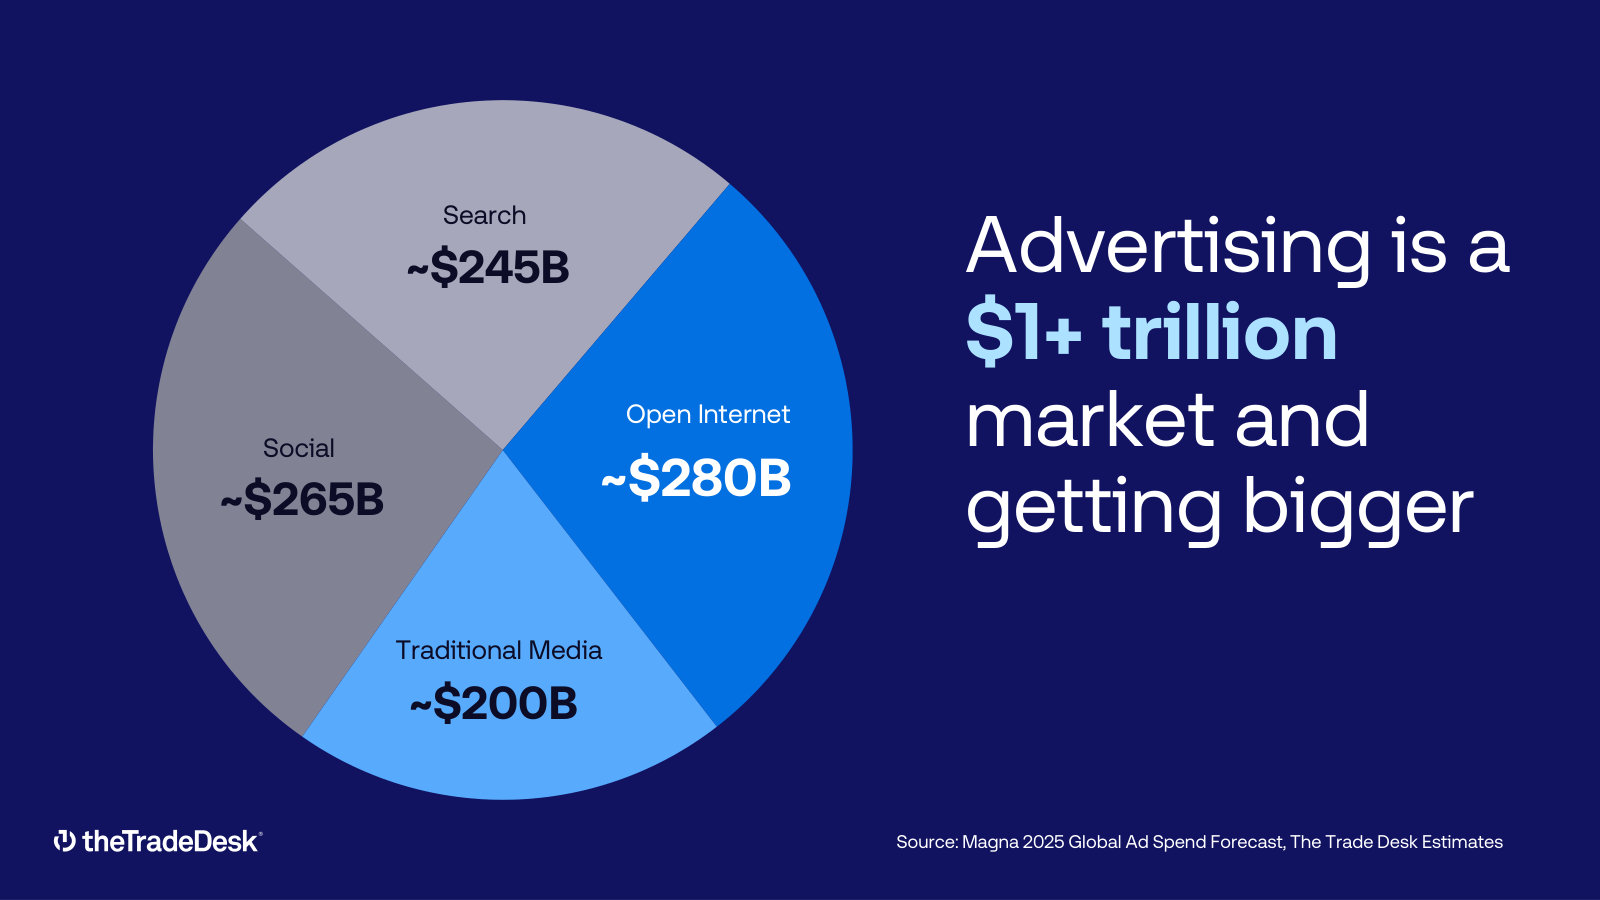
Digital advertising is the largest and fastest-growing part of a global ad market that, per the company's filings, passed $1 trillion for the first time in 2024. Digital alone is reported at over $700 billion — more than 70% of total ad spend — and management frames four converging trends behind programmatic's rise: the generational shift from linear TV to connected TV (CTV), AI-driven automation, a privacy-first tilt toward first-party data and measurement, and the fragmentation of audiences across a "long tail" of apps, sites and streaming services [2].
Global Ad Market ($B, 2024)
Digital Ad Spend ($B)
TTD Net Revenue ($B)
Global and digital figures reported as "over" the stated levels. Source: FY2025 Annual Report, Item 1 Business — Our Industry [3]; TTD revenue as reported (FY2025).
The point of the sizing is not that the market is large — it is that TTD's $2.9 billion of revenue is a rounding error against a $1 trillion pond, so the runway is real in both directions. These tailwinds are industry-wide: CTV growth and AI accrue to every DSP and to every walled garden, not to TTD alone. The moat question is therefore not how big is the market but how much of it TTD keeps — and against whom.
What makes the position defensible
Independence is structural, not a slogan. TTD works only for the buy side; it owns no media and sells no inventory of its own. Its filings argue this lets it avoid the conflict of interest carried by competitors that "also own and operate media," and management's stated thesis — set out to investors sixteen years ago — is that the industry ends with ten or fewer scaled DSPs, most of them conflicted because their duty to shareholders pulls against buying the best media for advertisers wherever it sits [4]. A walled garden that runs a DSP is, in effect, grading its own homework. That is a barrier a well-funded rival cannot simply copy: Google and Amazon could match the technology, but not the neutrality, without giving up the owned media that is their profit engine.
Scale within the independent lane. Among genuine independent buy-side DSPs — the only true like-for-like peers — TTD is not merely the leader; it is roughly eight times the size of the next one. Viant Technology, the closest independent pure-play, reported $344 million of FY2025 revenue against TTD's $2.9 billion [5]. Scale matters here because a DSP's edge compounds with the data flowing across it: more spend means more signal for the AI that decides which impression to buy.
Both companies run the same percentage-of-spend model and report revenue net of media cost. Source: TTD FY2025 10-K (revenue $2,896M); Viant FY2025 10-K, MD&A [6].
Clients stay. TTD reports a client retention rate above 95% in each of the last eleven years, and clients typically expand their spend over time — a land-and-expand pattern that turns retention into growth [7]. The honest caveat sits in the same disclosure: the master services agreements are terminable on 60 days' notice [8]. The switching cost is behavioral and workflow-based — retrained traders, rebuilt data integrations, lost optimization history — not contractual lock-in. Eleven years of 95%-plus retention says that cost is high in practice; the short-notice terms say it could fall quickly if performance slipped.
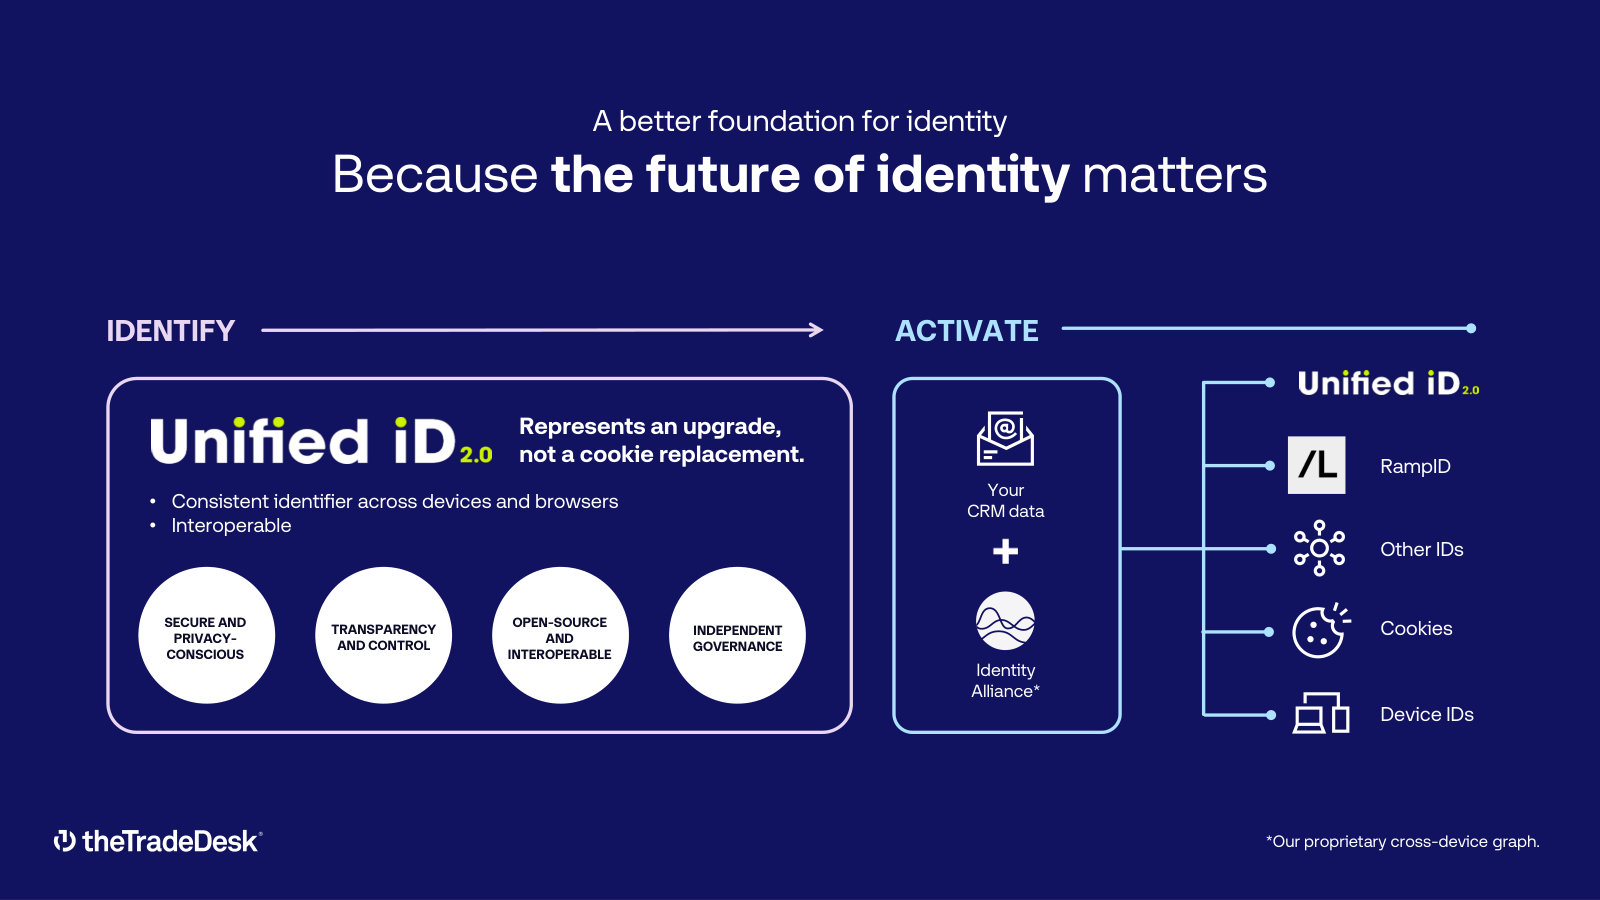
Identity is an asset the open internet needs and the walled gardens already have. TTD's Unified ID 2.0 is its answer to the decay of the third-party cookie, and management positions it as a differentiator Amazon cannot replicate for open-internet buying [9]. It is a genuine edge on the open web — but a defensive one: Google, Meta and Amazon already resolve identity through billions of logged-in users, so UID2 narrows a disadvantage rather than opening a lead.
Where the moat is tested
The clearest counter to the whole story came from an analyst on the Q2 2025 call: the open internet "seems to be losing market share when you consider the growth rates of major platforms like Meta, Amazon, and Google" — and, pointedly, who is TTD taking share from? Management called it "one of the most crucial questions we face today" and answered with a long-game argument about consumers' time and premium content shifting to the open internet, not with a near-term share number [10]. That is the tension the ~10% forward growth rate reflects: the pond is growing, but the walled gardens are taking more of the incremental dollar.
On Amazon specifically, TTD's rebuttal is more concrete. Management estimates Amazon's roughly $70 billion of 2025 advertising revenue is around 90% or more sponsored listings that compete with Google Search, with Prime Video a distant second and the Amazon DSP a "lower priority" — some 97% to 99% of Amazon's ad effort monetizing its own owned-and-operated inventory rather than deciding buys across the open internet [11]. The argument is credible on the open web, but it concedes the CTV front, where Amazon's Prime Video inventory and first-party data make it a direct and fast-growing competitor.
Two structural vulnerabilities sit underneath. First, dependence on rivals for supply: the FY2025 10-K states plainly that Google is "one of our largest advertising inventory suppliers in addition to being one of our competitors," and that suppliers are generally not bound by long-term contracts [12]. Second, the walled gardens can bring more resources, richer first-party data, and — for their own inventory — sell it directly in ways that shut TTD out entirely, while some competitors compete on "artificially low prices" enabled by the very conflicts TTD refuses to carry [13].
Identity cuts both ways. Three major browsers — Safari, Firefox and Edge — already block third-party cookies by default; Google reversed its long-promised Chrome deprecation in July 2024, and Apple's IDFA opt-in has already reshaped mobile [14]. TTD says it is well-positioned via UID2, but concedes the transition "could be more disruptive than we anticipate," particularly in display [15].
Positioning synthesized from TTD's own filings and calls. Sources: FY2025 10-K, Item 1 Business and Item 1A Risk Factors [16] [17]; Q3 FY2025 call [18]. MGNI and PubMatic are sell-side platforms, not buy-side comparables, and are excluded.
The read
The moat is real but narrow, and it is being defended on tightening ground. The durable part is structural and company-specific: independence that the walled gardens cannot copy without dismantling their own economics, scale roughly eight times the next independent DSP, and retention that has held above 95% for eleven straight years — advantages that show up in numbers, not just narrative. The narrowing part is that the tailwinds TTD rides are shared, the walled gardens are winning more of the incremental dollar, Amazon is a genuine CTV threat, and TTD depends on a competitor (Google) for some of its supply.
Two things separate execution from moat here. The Q4 2024 stumble (Financials and Estimates) was a self-inflicted platform-migration and sales problem, not evidence the competitive position eroded — a distinction worth holding. And what would change this read is measurable: sustained open-internet share loss, a slipping take rate (the platform fee TTD keeps on spend it intermediates, established in The Setup), retention falling below its decade-long floor, or Amazon choosing to build a real open-internet DSP. On today's evidence the position is defensible; the risk is that the market, not TTD's share of it, was the growth story.
Cash Conversion
The Trade Desk turns reported profit into cash at a high rate, and the balance sheet carries no goodwill to impair and no debt to service — so on the standard accrual test the earnings are real. Two qualifications matter for the reader who anchors on the roughly ten-times free-cash-flow multiple. First, $490.6M of the FY2025 cash flow is stock compensation added back; charged as a cost, the owner's cash roughly halves. Second, almost all of the year's 34% jump in operating cash was a one-time tax-timing benefit, not underlying momentum.
The single largest asset on the books — a $3.77B receivable — is also the balance sheet's largest risk to the debt-free, bankruptcy-remote reading. It is contained today, but its concentration is rising.
Earnings do convert to cash
The parts that hold up come first. Over the last three years, operating cash flow has run well above net income every year, and free cash flow has stayed above reported earnings — the pattern of a business whose profits are cash-backed rather than accrual-built.
Source: FY2025 Annual Report (Form 10-K), Consolidated Statements of Cash Flows [1]; ratios derived from reported financials.
The balance sheet reinforces the point. There is no goodwill and no material intangible balance to write down — the assets are cash, short-term investments, receivables, data-center property, and lease rights [2]. Cash and short-term investments were $1.30B against no drawn debt, so a value investor's first screen — how close is the chance of insolvency to zero — passes on its face [3]. What follows is where the headline cash number needs a second look, not a rejection of it.
What is inside the $993M
Operating cash flow of $992.7M is more than double the $443.3M of net income. The gap is not one thing; it is a stack of non-cash charges added back, netted against a working-capital outflow.
Source: FY2025 Annual Report (Form 10-K), Consolidated Statements of Cash Flows [4]. "Non-cash lease and other" and "Other working capital" aggregate smaller lines.
Two lines carry the story. Stock-based compensation of $490.6M is the biggest add-back — larger than net income itself [5]. And the working-capital picture cuts the other way from the common assumption about this business: the receivable grew $432.7M while payables grew only $291.1M, so the pass-through "float" between collecting from agencies and paying media was a net drain of roughly $142M in FY2025, not a source of cash [6]. The float funds growth; it does not manufacture reported cash.
The tax-timing lift behind the 34% jump
Operating cash flow rose 34% in FY2025, from $739.5M to $992.7M — outpacing the 13% growth in net income and the 18% in revenue [7]. Almost all of that acceleration sits in one line. Deferred income taxes swung from a $76.9M subtraction in FY2024 to a $167.7M addition in FY2025 — a $244.6M year-over-year change that alone explains 97% of the $253.3M rise in operating cash flow [8].
The cause is disclosed and specific: the One Big Beautiful Bill Act, enacted July 2025, let the company immediately deduct domestic research-and-development costs, and it recognized $175M as an income-tax receivable with a matching reduction in deferred tax assets [9]. The benefit is real cash — taxes actually paid fell to $150.1M from $158.6M even as pre-tax income rose 30% [10]. But it is a timing benefit whose size is a one-year event, and the company itself flags that OBBBA "could increase our effective tax rate and cash tax payments in future periods" [11]. Excluding the deferred-tax line from both years, operating cash was roughly flat — about $825M in FY2025 against $816M in FY2024.
Source: FY2025 Annual Report (Form 10-K), Consolidated Statements of Cash Flows [12]; "excluding deferred taxes" derived by removing the deferred-income-tax add-back from reported CFO.
This is a quality qualification, not an accusation: the cash is genuine, but the year's apparent acceleration in cash generation overstates the underlying trend.
Owner cash after stock compensation
Free cash flow was $795.7M — operating cash of $992.7M less $197.0M of capital spending [13]. On the roughly $8.0B enterprise value the report has established, that is close to a 10% free-cash yield. The number that reaches an owner is smaller, because $490.6M of it exists only because employees were paid in stock rather than cash [14]. Treated as the real cost it is, that compensation reduces free cash flow to about $305M.
Operating Cash Flow ($M)
Free Cash Flow ($M)
Stock-Based Comp ($M)
FCF After Stock Comp ($M)
Source: FY2025 Annual Report (Form 10-K), Consolidated Statements of Cash Flows and Non-GAAP reconciliation [15]; "FCF After Stock Comp" = free cash flow less stock-based compensation, derived.
Free cash flow of $795.7M includes the $490.6M stock-compensation add-back. Charged as a cost, free cash flow to owners was roughly $305M — a yield near 3.8% on enterprise value rather than the headline near 10%.
The fair counter is that the buyback more than covered the dilution: the company spent $1.38B repurchasing stock in FY2025 [16], cutting diluted weighted-average shares from 501.9M to 493.6M [17]. But that repurchase was funded by drawing cash down from $1.37B to $658M, not from the year's free cash flow, and the share count fell only about 1.7% for the spend [18]. The economics are closer to a business that pays out most of its distributable cash to hold dilution steady than to one compounding a 10% cash yield for owners.
Capital spending is climbing, and part is unpaid
The gap between operating and free cash flow is widening as the platform's data-center buildout runs. Capital spending tripled in two years — from $46.8M in FY2023 to $98.2M in FY2024 to $197.0M in FY2025 — while depreciation, which lags new assets, reached only $115.8M [19]. Free cash flow captured 92% of operating cash in FY2023 but 80% in FY2025, and that conversion will keep compressing while capital outlays run ahead of the depreciation catching up to them.
Source: FY2025 Annual Report (Form 10-K), Consolidated Statements of Cash Flows [20].
Reported free cash flow is also flattered by timing. Capital assets financed through accounts payable — equipment received but not yet paid for — rose to $104.5M from $20.5M a year earlier [21]. That roughly $84M step-up sits inside the payables that lifted operating cash and outside the $197M of cash capital spending, so it deflates cash capex and inflates free cash flow by a similar amount this year, with the cash payment still to come.
The $3.77B receivable
The receivable is the largest thing on the balance sheet: $3.77B, or 61% of total assets [22]. The Trade Desk bills agencies for the full media spend it places, then pays inventory and data suppliers — often before the agency pays it, and under "sequential liability" terms where, if the advertiser never pays the agency, the company must still settle with suppliers from its own funds [23]. That is the mechanism by which a debt-free company could still face a liquidity event: a large agency failure inside a $3.77B book.
Two facts bound the risk in opposite directions. The concentration is rising: in FY2025 two holding companies each exceeded 10% of gross billings and together accounted for 30% — against a single holding company at 14% in 2024 and 12% in 2023 [24]. Set against that, actual credit losses have been immaterial through the cycle: the allowance was $12.2M, three-tenths of one percent of the receivable, and the full-year provision was $1.5M against write-offs of $0.5M [25].
Accounts Receivable ($M)
Share of Total Assets
Top 2 Holdcos, % Billings
Credit-Loss Allowance
Sources: FY2025 Annual Report (Form 10-K), Consolidated Balance Sheets [26]; Note 2 Concentration of Risk [27]; allowance rollforward [28].
On balance, the bankruptcy-remote reading survives: $3.01B of matching payables, $1.30B of net cash, and no debt sit between the receivable and any owner loss, and a decade of near-zero write-offs argues the sequential-liability exposure is more theoretical than realized [29]. The concentration trend is the line to watch: the reserve has not yet been tested against a default by one of these larger holding companies.
The read
Earnings convert to cash, the balance sheet is clean, and insolvency risk is genuinely low — the conditions this reader requires before anything else are met. What the cash figures do not support is the simplest version of the cheap-on-cash-flow case. Roughly $490M of the free cash flow is stock compensation, most of the year's cash-flow acceleration was a tax-timing benefit that normalizes, and capital intensity is rising with part of it still unpaid. Net of those, the cash an owner can actually claim is closer to $305M than $796M, which reframes the multiple from near ten times free cash flow to the mid-twenties on owner cash. The evidence that would change this read is a year in which operating cash grows without the deferred-tax crutch and stock compensation keeps falling as a share of revenue; the evidence that would harden it is a receivable write-down from the concentrating agency base.
Margin of Safety
At $19.53 The Trade Desk's ~$8.03B enterprise value is just 10.1x free cash flow — a 9.9% yield a reverse-DCF reads as pricing in almost no long-run growth — yet that free cash flow is doubly flattered: it adds back $490.6M of stock-based compensation (owner cash ~$305M, 26.3x EV, a 3.8% yield), and 97% of its 34% FY2025 growth was a one-year OBBBA deferred-tax swing of $244.6M that left underlying operating cash roughly flat at ~$825M versus ~$816M [1] [2]. The de-rating stripped out the high-flyer premium — at roughly 22x trailing GAAP earnings and 6.7x adjusted EBITDA the price alone no longer disqualifies the stock — so whether it is cheap depends on which of those two flatterers a buyer credits. The strict reading does not make the cash illusory: cash taxes actually paid fell to $150.1M from $158.6M as pretax income rose about 30%, stock-based compensation has dropped from 25% of revenue to 20% to 17%, and the $1.38B FY2025 buyback more than offset the dilution it creates (Cash Conversion). The qualification is that the flatterers are non-recurring in size, not that the underlying cash is fake.
What the price is
The starting point is a clean capital structure: no drawn debt, and $1.30B of cash and short-term investments against a $9.34B equity value, so enterprise value is about $8.03B.
Share Price
Market Cap ($M)
Net Cash ($M)
Enterprise Value ($M)
Sources: 478.0M shares (434,900,142 Class A + 43,108,629 Class B) at $19.53 [3]; cash $658.2M and short-term investments $644.9M, no debt, FY2025 10-K balance sheet [4]. Price per market data.
The $1.30B of net cash is a genuine, if modest, floor — about $2.73 a share, or 14% of the price — and it is the concrete answer to a reader who wants bankruptcy risk near zero: there is no debt to default on, and the $3.0B of pass-through payables are more than covered by $3.77B of receivables (Cash Conversion). But it is a cushion, not the thesis. This is an operating business, not an asset play; the margin of safety, if it exists, has to come from earnings power bought cheaply, not from the balance sheet alone.
The multiple depends on which earnings you credit
The same enterprise value looks cheap or full depending on which profit figure sits in the denominator. On adjusted EBITDA — which adds back all $490.6M of stock compensation and $115.8M of depreciation — the business trades at 6.7x, a level usually reserved for no-growth industrials. On GAAP net income it is about 21x its equity value — 18x enterprise value once the $1.30B of net cash is netted off. The gap between the EBITDA and the GAAP multiples is almost entirely stock-based pay.
Sources: FY2025 Adjusted EBITDA $1,196.4M and stock-based compensation $490.6M [5]; net income $443.3M, operating cash flow $992.7M and capex $197.0M [6]. EV multiple derived from the $8.03B enterprise value.
Free cash flow of $795.7M sits in the middle at 10.1x enterprise value, a ~9.9% yield — the number that makes the headline case for a mispriced business. The Cash Conversion work established why that figure overstates distributable cash: $490.6M of it is a stock-compensation add-back. Treated as the real cost it is, owner free cash flow was about $305M, and the same enterprise value trades at 26.3x that figure — a 3.8% yield. The valuation argument is more sensitive to that one accounting choice than to any growth or margin assumption, as the yields below make plain.
Source: derived from FY2025 reported financials, 10-K [7] [8].
The counter to the strict reading is real and quantified: stock compensation as a share of revenue has fallen from 25% in FY2023 to 20% in FY2024 to 17% in FY2025, and the $1.38B FY2025 buyback more than offset the dilution it creates, trimming diluted shares about 1.7% [9]. If that trajectory continues, owner free cash flow grows faster than reported cash flow, and the 3.8% yield understates where the business is heading. The point is not that owner FCF is the only correct figure — it is that the true multiple sits well above 10x, somewhere in the range the falling stock-comp trend narrows over time.
Forward multiples, and estimates still being cut
On forward consensus, the optics improve — but the consensus itself is deteriorating. Analysts model ~$1.85 of adjusted earnings per share for FY2026 and ~$2.15 for FY2027, which put the stock at 10.6x and 9.1x forward adjusted earnings. Those figures again add back roughly a dollar per share of stock compensation; on estimated GAAP earnings the forward multiple is closer to the low-20s.
Source: consensus analyst estimates, as reported (as of 2026-07-11).
The FY2026 estimate has been cut about 11% over ninety days and the FY2027 estimate about 10%; over the last thirty days downward EPS revisions outnumbered upward ones by roughly 19-to-2, per consensus estimates. A single-digit forward multiple on a number that is still falling is not the same as a single-digit multiple on a stable one — the denominator has to stop shrinking before the cheapness is bankable. The Financials and Estimates tab lays out the full revision record.
The sell-side rating mix has drifted the same way: over four months the buy ratings thinned from 17 to 13 while holds and sells rose, leaving 13 buy, 19 hold and 4 sell across 36 analysts.
Source: consensus analyst ratings, as reported (as of 2026-07-11).
How much pessimism the price implies
For a reader who wants to know what is already discounted, the cleanest test is to reverse the arithmetic: hold the enterprise value fixed and ask what long-run growth the price embeds under each cash definition. Treating free cash flow, net of capex, as distributable and discounting at a 9% cost of capital, the implied perpetual growth rate is simply the discount rate less the starting yield.
Source: illustrative Gordon-growth arithmetic (implied growth = 9% discount rate less starting yield) on FY2025 reported cash figures [10]. A single-stage perpetuity is a deliberate simplification, not a price target.
The gap between the two readings is wide. On headline free cash flow the price embeds roughly no long-run growth — even slight decline — which is real pessimism against a still-growing, better-than-$1T digital-ad market (Independence Moat). On owner cash the price embeds about 5% perpetual growth, which for a business consensus still expects to grow revenue ~10% near-term is close to fair rather than pessimistic. The market is not obviously mispricing owner economics; it is heavily discounting the headline cash the strict accounting says overstates the truth. That is the honest reconciliation of the "cheap or trap" tension: both readings are internally consistent, and they differ only on stock compensation.
The margin-of-safety read
Two arm's-length marks cluster in the same place. Consensus mean and median price targets sit at $24.42 and $24.50, about 25% above the current price, with a wide $11-to-$38 range around them. And in March 2026, founder-CEO Jeff Green bought 6,000,000 shares in the open market for about $148M at $23.49 to $25.08 — informed capital paying roughly a quarter more than today's price, near the same level (Control and Pay). Neither is independent of the story — targets are falling and Green controls the vote — but both say the same thing: parties close to the business recently valued it in the low-to-mid $20s.
Source: consensus analyst price targets, as reported (as of 2026-07-11).
The evidence points to a business that has stopped being expensive without becoming deeply cheap. The de-rating cured the high-flyer problem — at 22x GAAP, 6.7x EBITDA and ~10x headline free cash flow, the price alone no longer disqualifies it — and the net-cash, no-debt balance sheet makes the downside a matter of valuation rather than solvency. A margin of safety of the size the headline yield implies is present only if stock compensation is treated as non-cash; charged as a real cost, the stock is roughly fairly priced at ~26x owner cash and a 3.8% yield for a ~10% grower — a reasonable price for a quality franchise rather than a clear bargain. The strongest fact against that read is the falling stock-comp ratio (25% to 17% of revenue in three years): if it keeps compressing and growth holds near 10%, owner cash grows into the multiple and the discount reappears from the earnings side.
What would change the read in the reader's favor: a price nearer $14-15, which would restore a double-digit owner-cash yield and a real cushion; stock compensation falling into the mid-teens as a share of revenue and staying there; or growth re-accelerating above the ~10% consensus. Against it: further estimate cuts that turn the single-digit forward multiple into a mirage, or the open-internet share erosion (Independence Moat) pulling growth below the ~5% the price already embeds on owner cash.
Growth Deceleration
The valuation case built in Margin of Safety is most sensitive to whether revenue growth has settled near 10% and holds there. The record does not yet support that. The Trade Desk's Q4 2024 shortfall was diagnosed as fixable execution — a botched platform migration and a rushed reorganization — and the first quarter of 2025 briefly seemed to confirm the fix. But year-over-year growth has stepped down in every quarter since, from 25% to a Q2 2026 guide of roughly 8%, and the slide continued well past the point the reorganization and the platform transition were declared complete.
The miss that broke the streak
On February 12, 2025, The Trade Desk reported fourth-quarter revenue of $741 million, up 22% year over year — a number that would flatter almost any company its size, except that management had guided the Street to "at least $756 million" three months earlier [1]. It was the first time the company had missed its own revenue guidance since going public in 2016, closing a run of more than eight years of hitting the number every quarter [2]. The stock fell roughly 40% over the following weeks [3].
Chief executive Jeff Green did not blame the market. He attributed the shortfall to "a series of minor execution errors" made while the company tried to run the business and rebuild it at the same time — turning the ball over, in his sports framing, too many times in one quarter [4]. In December 2024 the company had executed what Green called "the largest reorganization in company history": it redrew reporting lines for most employees, split client teams so some served brands and others served agencies, and broke the engineering group into nearly 100 agile scrum teams to finish moving every client from the older Solimar platform to the newer Kokai release [5].
The important feature of that diagnosis is that it is self-limiting. A migration finishes; a reorganization settles. If the Q4 2024 miss was genuinely execution, growth should reaccelerate once the disruption clears.
A recovery that did not hold
For one quarter, it looked as though it had. First-quarter 2025 revenue of $616 million grew 25% year over year, and the chief financial officer opened the call by saying the company had "started 2025 on a strong note" [6]. Green added that Kokai adoption was "now ahead of schedule," with roughly two-thirds of clients on the platform and the bulk of spend already flowing through it; he expected every client migrated by year-end [7]. The self-inflicted-wound story had a tidy arc: the wound was closing.
The quarters that followed did not cooperate. Growth ran 19% in Q2 2025, 18% in Q3, 14% in Q4, and 12% in the first quarter of 2026 — each print a beat against reduced guidance, each one a step down in the underlying rate.
Source: derived from reported quarterly revenue, FY2023–Q1 FY2026; 2Q26E is the implied rate on the company's Q2 2026 revenue guide of at least $750 million [8]. Q4 2024 (4Q24) is the guidance miss.
The chart shows the pattern directly. The Q4 2024 dip to 22% was a blip — Q1 2025 bounced back to 25% — but from mid-2025 onward the rate falls quarter after quarter with no interruption. Crucially, the decline runs straight through the second half of 2025, by which point Kokai was fully deployed and the December 2024 reorganization was a year in the past. Whatever is pulling growth down, the platform migration and the reorganization had stopped being the explanation.
Guidance reset lower
Management's guidance behavior since the miss tells the same story from a different angle. After Q4 2024, the company reset expectations lower and has since cleared them — but the year-over-year rate embedded in each guide has kept falling.
Sources: Q3 2024, Q4 2025, and Q1 2026 earnings releases (Financial Guidance) [9] [10] [11].
Q1 2026 revenue of $689 million beat the "at least $678 million" guide and grew 12%; Green called it "another strong quarter" [12]. But the Q2 2026 guide of "at least $750 million" implies about 8% growth against the year-earlier $694 million — the first guided rate in single digits [13]. The company now clears the bar it sets; the bar itself keeps descending.
FY2024 revenue growth
FY2025 revenue growth
Q2 2026 guided growth
Source: FY2024 and FY2025 revenue as reported; Q2 2026 is the implied rate on the at-least-$750 million guide [14].
Cyclical or structural
Management's current explanation has shifted from execution to the economy. Asked directly about the deceleration in the Q2 2026 outlook, Green pointed to the company's concentration in large advertisers — most revenue comes from Fortune 500 brands, which respond to macro shocks differently than small businesses — and to tariffs, geopolitical instability, and broader consumer pressure weighing on those budgets [15]. If that framing is right, growth is cyclically depressed and reaccelerates when the macro clears.
Two facts sit against a purely cyclical read. The first is a peer. Viant Technology, the next-largest independent demand-side platform — a genuine like-for-like on the buy side, though roughly one-eighth of The Trade Desk's revenue — grew 25% in the same quarter The Trade Desk grew 12%, and guided to accelerating growth through 2026 on the same CTV and open-internet tailwinds The Trade Desk cites [16]. A common macro would be expected to slow both; a smaller rival growing twice as fast points to something specific to The Trade Desk — most plausibly the arithmetic of scale, as a company approaching $3 billion of revenue on $13 billion of platform spend simply has a larger base to grow.
The second is a self-inflicted friction that has nothing to do with the macro. Through the first half of 2026 The Trade Desk was in a public fee dispute with Publicis, one of the largest agency holding companies and a partner since 2018; the two settled in June 2026, and Green pointedly declined to say more on the Q1 call beyond confirming that negotiations were ongoing [17] [18]. Layered on top are the board and finance-team departures examined in Control and Pay. None of this is macro; all of it is friction at exactly the moment the growth rate is being tested.
The evidence does not cleanly decide between cyclical and structural, and it is worth being honest about that. The bull read is coherent: a large-brand buyer is disproportionately exposed to a macro air pocket, the Publicis overhang has cleared, Kokai and the new Koa agentic-AI tools are still ramping, and international and CTV continue to outgrow the blended rate. The bear read is equally coherent: growth has decelerated for six straight quarters through the fix, the guide is now in single digits, and a much smaller independent peer is compounding at twice the rate on identical tailwinds. What separates them is not argument but the next few prints.
What to watch
The deceleration is falsifiable, and the checkpoints are close.
The Q2 2026 result, against the roughly 8% guide. A beat that reaccelerates the year-over-year rate would support the cyclical read; a print that merely clears a low bar while the rate keeps sliding would not. This is the most decision-relevant near-term number, because the valuation in Margin of Safety implicitly assumes owner-cash growth of about 5% — which requires revenue growth to stabilize, not keep falling.
The second half of 2026. Management frames the current softness as macro and points to the Publicis settlement and easier comparisons. If growth has not turned up by the fourth quarter — against year-earlier quarters that were themselves already decelerating — the macro explanation weakens and the base-rate-of-a-large-company explanation strengthens.
The gap to independent peers. If Viant and other independents continue to outgrow The Trade Desk by double-digit margins into 2027, the deceleration is company-specific and the "temporary" framing becomes harder to sustain.
On the mispricing question this report turns on, the numbers already established make the price defensible if growth holds near 10%. The evidence in this chapter is that growth has not yet held near 10% — it is still stepping down, and the guide points lower still. That does not make the case a value trap; it makes the next two quarters the place where the trap-or-bargain question is actually settled.
Mix and Take Rate
The Trade Desk's take rate — revenue as a percentage of the gross advertising spend it processes — stepped up in FY2025 rather than compressing: gross spend on the platform grew 11% to $13.4 billion while revenue grew 18%, lifting the take rate to roughly 21.6% from a stable ~20.3% [1]. The composition underneath — connected TV now the largest channel, retail data attaching to more spend — is where the premium comes from, and where the deceleration also shows first.
Gross Spend (FY2025)
Take Rate (FY2025)
Revenue Growth
Gross-Spend Growth
Source: FY2025 Annual Report (Form 10-K), Item 7 MD&A Executive Summary — gross spend $13,394,683 thousand, revenue $2,896,284 thousand [2].
The take rate held, then widened
The Trade Desk does not sell media; it charges a platform fee that is generally a percentage of what a client spends buying advertising through the platform, plus revenue from data and value-added services [3]. The company itself calls revenue as a percentage of gross spend the take rate, and warns in each filing that it will fluctuate with the mix of services clients select and with volume discounts [4].
Across the four years where gross spend is disclosed, that rate has been strikingly stable near 20%, then stepped up in FY2025.
Source: derived from reported revenue and gross spend, FY2022–FY2025 10-Ks — FY2022 $7,741M and FY2023 $9,611M gross spend [5]; FY2024 $12,041M and FY2025 $13,395M [6].
The stability matters because the standing bear worry on this business, for the full decade it has been public, is that the fee must eventually erode toward the low-single-digit rates walled gardens advertise. FY2025 ran the other way: revenue outgrew the actual dollars flowing through the platform by roughly seven points.
Source: FY2025 Annual Report reports FY2025 revenue up 18% and gross spend up 11% [7]; FY2023–FY2024 growth derived from the same disclosures [8].
That wedge cuts two ways, and both belong in the read. It confirms pricing power: the company is capturing more per dollar even as growth cools, which is what a durable moat in value-added data should look like. It also flags that the underlying volume of advertising running through the platform — gross spend — grew only 11% in FY2025, decelerating harder than the 18% revenue line. Part of the reported top-line growth is take-rate expansion that need not repeat; the raw demand signal beneath it is softer than the headline suggests. That is the same slowdown the Deceleration chapter traces, seen one layer down.
What the spend is made of
The Trade Desk reports channel and geographic mix qualitatively on every call rather than in the filings, so the shares below are the midpoints of management's disclosed ranges. The shift they describe is unambiguous: connected TV, folded into video, has moved from second place behind mobile to the largest and fastest-growing channel.
Sources: Q2 2021 call — mobile a low-40s share, video a high-30s share, display and audio about 15% and 5% [9]; Q3 2024 — video a high-40s share, mobile mid-30s, display low double-digit, audio around 5% [10]; Q1 2025 similar [11].
In Q2 2021, mobile was the largest channel at a low-40s share and video a high-30s share [12]. By Q1 2025, video including CTV held a high-40s share and was still growing as a fraction of the mix, mobile had eased to the mid-30s, display sat at a low double-digit share and audio held near 5% [13]. CTV is both the best channel — premium, data-rich inventory the walled gardens do not fully control — and the one management names as leading growth "by a wide margin" quarter after quarter. The mix is shifting toward exactly the inventory where an independent buy-side platform is hardest to displace, which is the concrete version of the independence case made in Independence Moat.
The international share that has not moved
Management describes international as a persistent growth engine: spend outside North America outpaced spend inside it for the ninth consecutive quarter as of Q1 2025, and for the seventh consecutive quarter as of Q3 2024 [14] [15]. Yet the share of spend has barely moved. International was about 13% of spend in Q2 2021 and about 12% by Q1 2025 [16] [17].
Sources: Q2 2021 — North America 87%, international 13% [18]; Q3 2024 and Q1 2025 — North America about 88%, international about 12% [19] [20].
The two facts reconcile: the "outpacing" streak is recent, running from roughly 2023, and before it North American CTV grew faster during the 2021–2022 streaming surge. Nine quarters of faster international growth have clawed the share back toward, not past, where it stood four years earlier. International remains a long runway rather than a lever already pulling the blend up — a useful correction to any bull case that leans on geography to reaccelerate the whole business quickly.
Why the premium holds
Management's answer to the compression worry is that low headline fees are not the same as low cost. On the Q4 2025 call, Jeff Green noted that for the decade the company has been public there has been "a narrative that our margin or take rate must compress" because rivals advertise lower upfront prices, and argued those models make it up by marking up their own owned-and-operated inventory [21]. He cited an agency strategy VP: even where a commerce walled garden charges "1% or no fees," the effective CPM the agency pays ends up higher than on comparable Trade Desk campaigns, once weaker reporting and pricier data are counted [22].
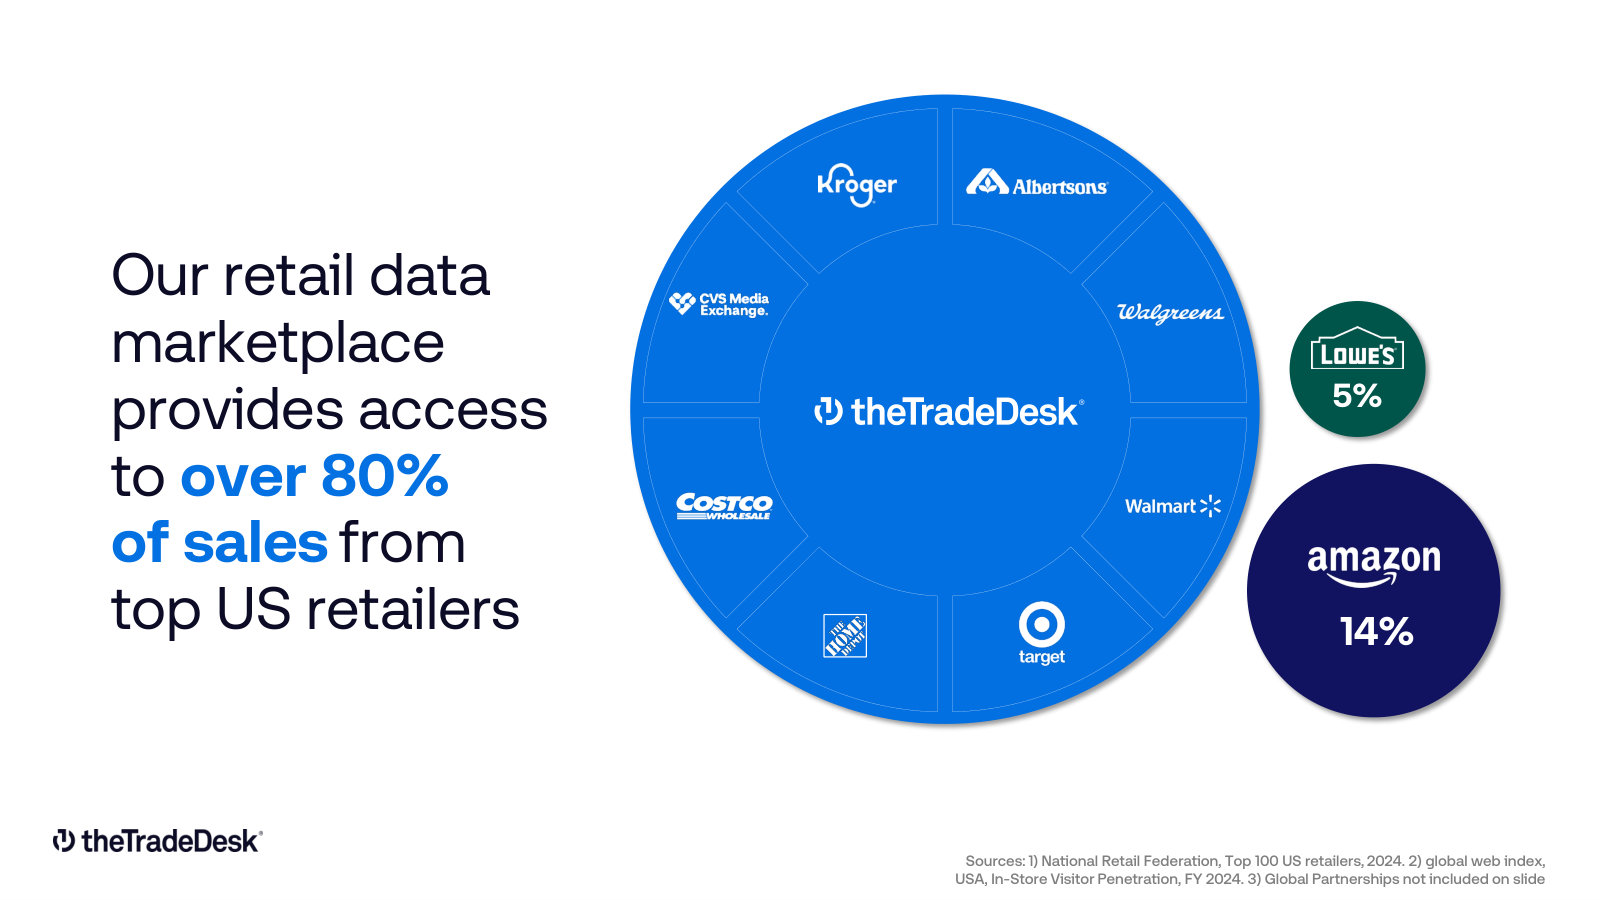
The mechanism that lifts the effective take is data. The company frames leaning into data and value-added services as a shared win — better returns for advertisers, higher CPMs for content owners, and more revenue for The Trade Desk [23]. Retail data is the newest and largest expression of it: spend influenced by retail data hit record levels in 2025, the retailers in the marketplace represent more than half of global retail sales, and most send their data through the company's UID2 identity framework [24]. The FY2025 filing names third-party and first-party retail data, and AI embedded in the platform, among the core drivers of future growth [25]. More attached data per campaign is the plausible reason the take rate widened in FY2025 rather than eroding.
The strongest fact against this read comes from the company's own risk disclosure: it warns that as programmatic matures, growth in spend may outpace growth in revenue because of pricing competition, volume discounts, and shifts in media, client, and channel mix [26]. That is a precise description of take-rate compression, and it is the outcome the FY2025 numbers did not produce — but it names the conditions under which they would. The read here is that the premium is holding on evidence, not assertion: the disclosed take rate rose while volume growth slowed, which is consistent with a mix shift toward data-rich CTV and retail rather than a race to cheap reach. What would change it is a reversal of the FY2025 pattern — gross spend growing faster than revenue for consecutive quarters, or a step-down in take rate — which would signal that volume discounts to hold large agencies are finally outrunning the data attach.
Watch item: gross-spend growth relative to revenue growth. FY2025 revenue grew 18% while gross spend grew 11%, expanding the take rate to about 21.6%. If that inverts and gross spend begins to outpace revenue, the take rate is compressing and the volume slowdown is no longer being cushioned.
Control and Pay
Jeff Green controls 49.7% of The Trade Desk's votes on roughly 11% of its economics inside a founder-friendly Nevada charter and a board that just lost three directors, so outside holders have little formal leverage; but his 2021 performance option (strike $68.29, hurdles to $340) is worthless at $19.53 and he bought about $148 million of stock in March 2026, so his downside is the shareholder's downside. On control, a professional investor here is a passenger, not a driver; on alignment, the founder rides in the same seat. Two facts qualify the alignment side and belong in the same frame: the SEC pay-versus-performance table's "compensation actually paid" of negative $856.8 million in 2025 is mark-to-market paper, not cash that left the company, and in April 2025 the board granted $30 million of fresh, time-vesting equity that pays whether or not the stock recovers — so the alignment is real, but not the pure eat-what-you-kill picture the underwater option alone implies.
Whether the fallen share price is opportunity or trap (The Setup) depends partly on whether that concentrated control is matched by concentrated exposure. This chapter separates two questions that are easy to blur: control — how much say an outside shareholder has — and alignment — whether the CEO's own money moves with theirs. On this name, the answers point in opposite directions.
Green Voting Power
Green Economic Stake
CEO Pay, FY2025
CEO : Median Pay
Sources: 2026 proxy statement, Ownership table [1] and CEO Pay Ratio [2].
Control: half the vote on a tenth of the economics
The Trade Desk runs two share classes. Class A carries one vote; Class B carries ten. Green holds 97.6% of the Class B stock — 42.07 million shares — plus 11.48 million Class A shares, which together give him 49.7% of the total voting power on about 11.2% of the shares outstanding [3]. Counting the rest of the executives and directors, insiders hold 49.8% of the vote [4]. One more Class B share tips it past a majority; in practice, no outside coalition can carry a vote he opposes.
The institutions that own most of the economics own almost none of the say. Vanguard's funds hold 12.6% of the Class A stock but only 6.3% of the vote; BlackRock, State Street and Baillie Gifford together hold roughly a fifth of the Class A shares and about a tenth of the votes [5]. The two bars below show that gap: institutions own most of the economics and a fraction of the votes.
Source: derived from the 2026 proxy Ownership table — 434,900,142 Class A and 43,108,629 Class B shares outstanding [6].
Dual-class control is common among founder-led technology companies, and by itself it is neither good nor bad — it lets a founder run for the long term without answering to a proxy season. What sharpens it here is the surrounding structure, and a stretch of turnover that thinned the board:
- Combined chair and CEO. Green is both chairman and chief executive; the independent directors say they "intend to appoint" a lead independent director, language that concedes one is not yet in place [7].
- A board that shrank fast. Three directors left within about two weeks in early 2026 — Kathryn Falberg on March 23, and Lise Buyer and Gokul Rajaram on April 3 — including both members of the compensation committee [8]. The board is now five directors, three of them independent.
- A one-person audit committee. The proxy states plainly that the audit committee "is currently comprised of one member" [9]. For a company of this size, a single-member audit committee is a thin line of oversight, even if temporary.
- A Nevada charter. The company's amended articles limit director and officer liability "to the fullest extent permitted by Nevada law," a regime generally read as more management-protective and less litigation-friendly to minority holders than Delaware [10].
None of these is a scandal. Taken together, they describe a company where the formal checks an outside shareholder would normally rely on — an independent chair, a full board, a majority they can influence, a friendly forum for litigation — are unusually light. An investor here is trusting the founder, not the guardrails.
Pay: a large package against a falling stock
Green's FY2025 total compensation was $27.4 million: a $1.35 million salary, a $2.8 million cash incentive, and $23.2 million of new equity — split between restricted stock and options — granted in April 2025 [11]. That put his pay at 125 times the $218,847 median employee [12]. The dollar figure is large, but the median is a reminder that this is a highly-paid technical workforce, not a low-wage one.
The headline understates the year-to-year lumpiness. Green took no new equity in 2024, so his reported pay swings with the grant calendar: $32.0 million in 2023, $6.8 million in 2024, $27.4 million in 2025 [13].
Source: 2026 proxy statement, 2025 Summary Compensation Table [14].
The long-term incentive that is supposed to anchor Green's pay is the 2021 CEO Performance Option: a ten-year, market-based grant to buy up to 16 million Class A shares at target, struck at $68.29 — the closing price on the October 2021 grant date [15] — with a grant-date fair value of roughly $819 million [16]. It vests in eight tranches only as the shares hit escalating price goals, the first at $90 and the last at $340 [17]. At $19.53, none of that is within reach. The strike alone is about 3.5 times the current price, and the first vesting hurdle roughly 4.6 times it.
Source: 2026 proxy statement, Performance Option terms and vesting table [18] [19]; current price as of 2026-07-10.
Alignment: the same option that makes his pay look real
An underwater option is not just a footnote; on the SEC's own pay-for-performance measure it dominates the picture. Regulation S-K requires companies to disclose "compensation actually paid" (CAP), which re-marks equity to its current value each year rather than its value at grant. Because Green holds a 16-million-share option, his CAP swings enormously with the stock. In 2025 his CAP was negative $856.8 million — the mark-to-market collapse of that option — against a summary-table figure of $27.4 million [20]. Over the same window, $100 invested in the stock at the end of 2020 was worth $47.39, versus $137.99 for the peer group [21].
Source: 2026 proxy statement, Pay Versus Performance table [22].
The table below sets the two pay concepts side by side against shareholder return. No cash changed hands; the negative figure is the mark-to-market swing on his option. His paper wealth rises and falls with the stock, by hundreds of millions of dollars a year.
Source: 2026 proxy statement, Pay Versus Performance table; "TTD Value" and "Peer Value" are the worth of $100 invested at the end of 2020 [23].
Alignment shows up in cash, too, not just paper. Over three trading days in early March 2026, with the stock in the low $20s, Green bought six million Class A shares in the open market for about $148 million.
Source: SEC Form 4 insider-transaction filings, March 2026 (open-market purchases), as reported.
This is not a routine grant vesting or a 10b5-1 diversification sale; it is the founder putting fresh personal capital into the stock near its lows. Set against a roughly 11% economic stake and a worthless performance option, it is the strongest evidence that Green's downside is the shareholder's downside.
Where the two readings collide
The place the control and alignment stories genuinely conflict is the board's April 2025 decision. Having already granted Green a market-based option that only pays if the stock roughly quintuples, the board approved a fresh $30 million target equity award — $23.2 million of grant-date value — split between options and restricted stock that vests in equal quarterly installments over four years on nothing more than continued employment [24]. Earlier proxies had described the 2021 option as the award the board "currently anticipates" will be Green's "exclusive equity award through the performance period," while reserving discretion to grant more [25]. Once the option went out of the money, the board used that discretion: the current proxy has dropped the "exclusive award" language, and the time-vesting grants that replaced it pay regardless of where the stock goes.
That is the give-back inside an otherwise well-aligned package. The performance option ties Green to an ambitious outcome; the new restricted stock pays him tens of millions for showing up, whether the shares recover or not. Stockholders endorsed the prior year's program — a majority supported the say-on-pay vote at the 2025 annual meeting, and the company has moved to hold that vote annually [26] — but with the vote non-binding and control concentrated, that endorsement carries limited weight.
Watch item: whether the board continues to layer time-vesting equity onto the underwater performance option. Repeated large service-based grants would steadily convert a pay-if-you-win package into pay-anyway.
The read that fits the evidence: on control, the formal protections an outside shareholder relies on are unusually light — a founder-friendly charter, a currently thin board, and no majority that outsiders can influence. On alignment, the case is stronger than the pay headline suggests — an 11% economic stake, a worthless option, and a $148 million personal purchase near the lows all point the same way. What would move the alignment read the other way is more of what happened in April 2025: additional service-based equity that pays Green even if the stock does not recover, or a resumption of insider selling. What would firm up the control concern is a lasting failure to rebuild the board and its audit committee. Both are things a reader can watch each proxy season, and neither is settled today.
Scenarios and Watch List
Whether the 86% fall left a genuinely mispriced business or one that is still de-rating turns on a small set of things that are measurable, dated, and mostly arrive within a year. This chapter reconciles the report's tensions and lists what to watch, without picking a winner the evidence has not yet chosen.
Share Price
EV / Free Cash Flow
EV / Owner Cash
Consensus Mean Target
Sources: price and consensus target as of 2026-07-11, consensus estimates as reported; multiples derived from FY2025 reported cash flow and balance sheet [1].
The shared facts, read two ways
Each of the report's load-bearing findings is a fact both a bull and a bear accept — the disagreement is over what it means, and in every case a specific, checkable datum would settle it. That is the useful shape of the case: not competing opinions, but one set of numbers awaiting a few more prints.
At $19.53 The Trade Desk's ~$8.03B enterprise value is just 10.1x free cash flow — a 9.9% yield a reverse-DCF reads as pricing in almost no long-run growth — yet that free cash flow is doubly flattered: it adds back $490.6M of stock-based compensation (owner cash ~$305M, 26.3x EV, a 3.8% yield), and 97% of its 34% FY2025 growth was a one-year OBBBA deferred-tax swing of $244.6M that left underlying operating cash roughly flat at ~$825M versus ~$816M (Margin of Safety, Cash Conversion) [2]. Growth has stepped down for six straight quarters, from 25% in Q1 2025 to a Q2 2026 guide of about 8% — the first single-digit guided rate — and it kept falling straight through the December 2024 reorganization and the Kokai migration management blamed for the original miss (Deceleration) [3]. The take rate widened anyway, to about 21.6% from a stable 20.3%, because revenue grew 18% while the $13.4B of gross spend on the platform grew only 11% (Mix and Take Rate) [4].
Sources: valuation and cash figures, FY2025 10-K Cash Flows and Balance Sheet [5] [6]; guidance, Q1 FY2026 earnings release [7]; take rate, FY2025 10-K MD&A [8]; insider purchases per SEC Form 4 filings.
One feature runs under all five rows and narrows the range of outcomes: the balance sheet holds cash and short-term investments of about $1.30B and no drawn debt, so downside here is a question of valuation, not survival [9]. Net cash is $2.73 a share, roughly 14% of the price — a floor thin enough that this is not an asset play, but firm enough that the bear case is a lower multiple rather than a going-concern risk.
The pivot that moves the scenarios
The report's read is most sensitive to one input: the revenue growth rate, because the valuation's implied ~5% perpetual growth on owner cash is only conservative if the top line settles near the high-single to low-double digits. The six-quarter step-down is the reason that assumption is not yet demonstrated.
Source: quarterly revenue per company filings; Q2 2026 is the company's guide of at least $750M against $694.0M a year earlier [10].
Consensus expects the rate to hold near this level rather than break lower: about $3.18B of revenue in FY2026 and $3.48B in FY2027, both roughly 10% growth, with adjusted earnings near $1.85 and $2.15. But the estimates have been moving the wrong way — the FY2026 adjusted-EPS figure has been cut from about $2.07 ninety days ago to $1.85, and downward revisions have outnumbered upward ones by roughly nine to one over the past month. The market's own forecast is for stabilization; its recent behavior has been to keep trimming.
Three paths
The consensus target range — a low of $11, a mean of $24.42, a high of $38 against the $19.53 price — is a useful frame because it brackets the operating outcomes rather than betting on one. Each end corresponds to a coherent story the report has already sourced.
Sources: consensus target range and estimates as reported; operating assumptions drawn from FY2025 10-K MD&A [11] and the Q1 FY2026 earnings release [12].
The base path is where the arm's-length evidence clusters. Consensus mean and median targets sit at $24.42 and $24.50, and the founder's March 2026 open-market purchases — roughly $148M at $23.49 to $25.08 a share — landed in the same band, which is why the reset reads closer to fair than to a deep discount on owner economics. The bull path needs a print, not a story: a quarter that reaccelerates the rate rather than merely clearing a lowered bar would convert the ~10% base the valuation assumes from a hope into a demonstrated floor, and the balance-sheet quality plus the widening take rate are the evidence it could. The bear path needs the opposite — the gross-spend line, which grew just 11% against 18% revenue, is the early-warning gauge, because underlying ad volume decelerated harder than the top line and part of the reported growth was rate that need not repeat.
What to watch
Each item below is falsifiable, named to the line item and filing where it will surface, and ordered by how much it moves the read. The Q2 2026 result, due in early August 2026, carries the most decision value, because it is the first datum that tests the deceleration against management's cyclical framing after the fix is complete.
Sources: watch items drawn from the FY2025 10-K [13], the Q1 FY2026 earnings release [14], and SEC Form 4 insider filings; the $327M repurchase authorization is disclosed in the Q1 FY2026 release.
For a value and special-situation investor, the check that matters most sits at the top of the list. The reset has already cured the high-flyer problem the reader avoids, and the net cash with no debt takes bankruptcy — the reader's stated fear — close to zero. What it has not yet delivered is a margin of safety: on owner cash the price is 26.3x — a 3.8% yield for a roughly 10% grower — so on that measure the price is fair, and a fair price becomes a cheap one only if growth proves it is a floor. The next two prints, read against the ~8% guide and the gross-spend gauge, are what turn this from a business that is merely no longer expensive into one that is genuinely mispriced — or confirm that the de-rating was the market correctly repricing a slower business.